 9
9peptides
spectra
0.000 | 0.000
0.000 | 0.000
0.004 | 0.038
0.000 | 0.000
0.000 | 0.000
0.596 | 0.630
0.349 | 0.372
0.000 | 0.000
| Plot | Mito | Lyso | Perox | ER | Golgi | PM | Cytosol | Nucleus | |||||
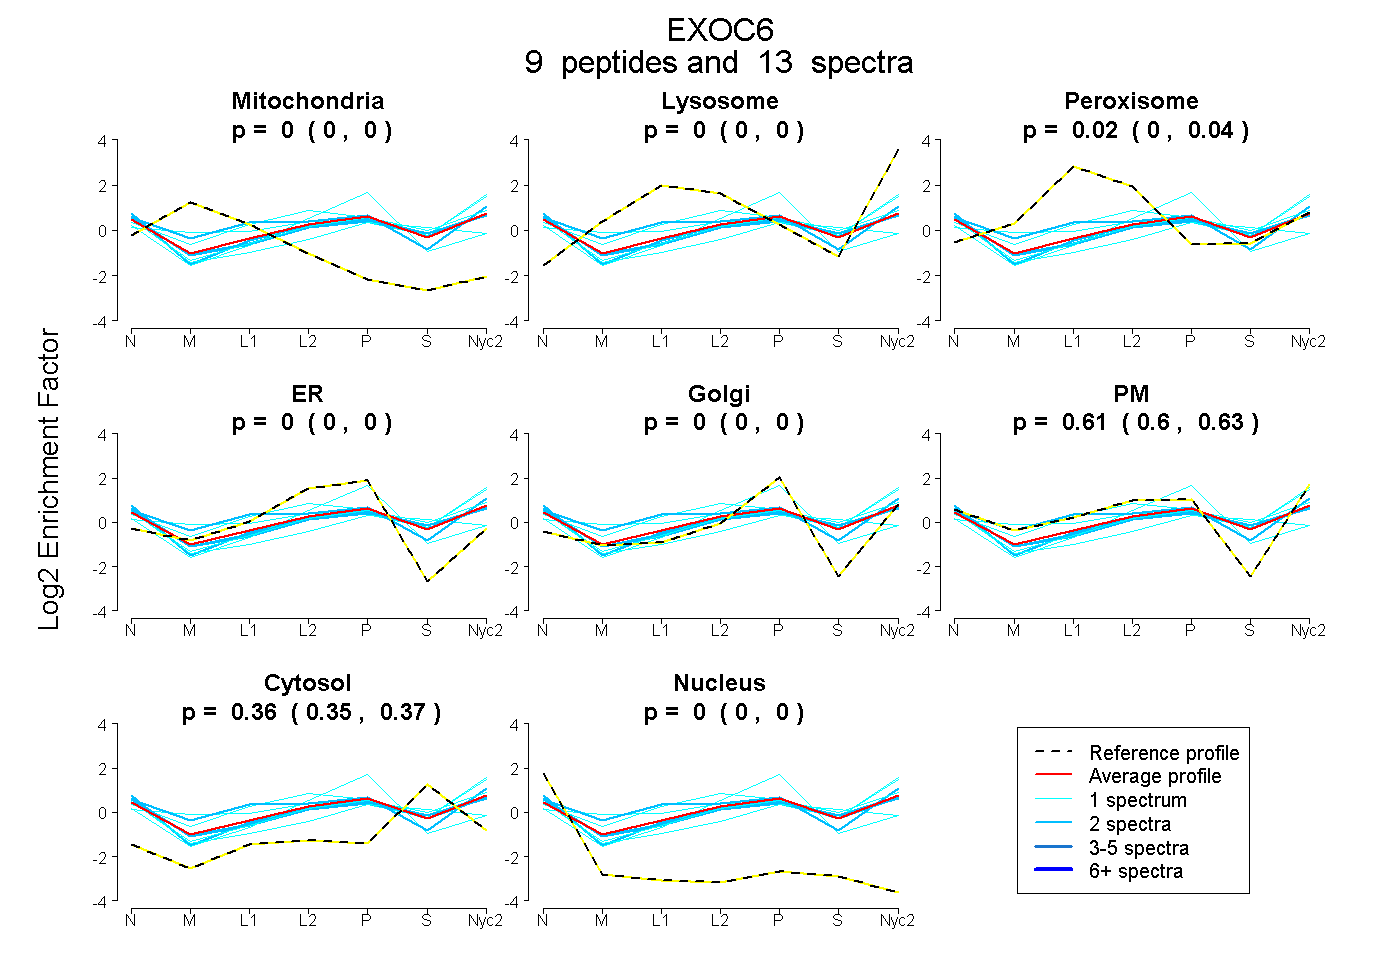
| Expt A |
9 peptides |
13 spectra |
|
0.000 0.000 | 0.000 |
0.000 0.000 | 0.000 |
0.023 0.004 | 0.038 |
0.000 0.000 | 0.000 |
0.000 0.000 | 0.000 |
0.615 0.596 | 0.630 |
0.362 0.349 | 0.372 |
0.000 0.000 | 0.000 |
| 1 spectrum, SIFQVFTHLPGK | 0.000 | 0.000 | 0.000 | 0.008 | 0.047 | 0.400 | 0.499 | 0.045 | ||
| 2 spectra, IIAVLR | 0.000 | 0.000 | 0.000 | 0.000 | 0.000 | 0.590 | 0.410 | 0.000 | ||
| 2 spectra, EVIEQTEDIIR | 0.000 | 0.000 | 0.000 | 0.000 | 0.000 | 0.604 | 0.396 | 0.000 | ||
| 2 spectra, STNLLLTR | 0.000 | 0.000 | 0.155 | 0.000 | 0.000 | 0.644 | 0.201 | 0.000 | ||
| 1 spectrum, NNIFAQFR | 0.000 | 0.128 | 0.129 | 0.000 | 0.000 | 0.502 | 0.241 | 0.000 | ||
| 2 spectra, SSTEIDDMLR | 0.000 | 0.000 | 0.000 | 0.000 | 0.000 | 0.595 | 0.405 | 0.000 | ||
| 1 spectrum, AESGEALGTVPEHER | 0.000 | 0.223 | 0.028 | 0.000 | 0.000 | 0.466 | 0.283 | 0.000 | ||
| 1 spectrum, QSFPK | 0.000 | 0.000 | 0.000 | 0.460 | 0.278 | 0.011 | 0.251 | 0.000 | ||
| 1 spectrum, VQVTDTNR | 0.000 | 0.000 | 0.000 | 0.000 | 0.000 | 0.587 | 0.413 | 0.000 |
| Plot | Mito | Lyso or Perox | ER | Golgi | PM | Cytosol | Nucleus | ||||||
| Expt B |
2 peptides |
3 spectra |
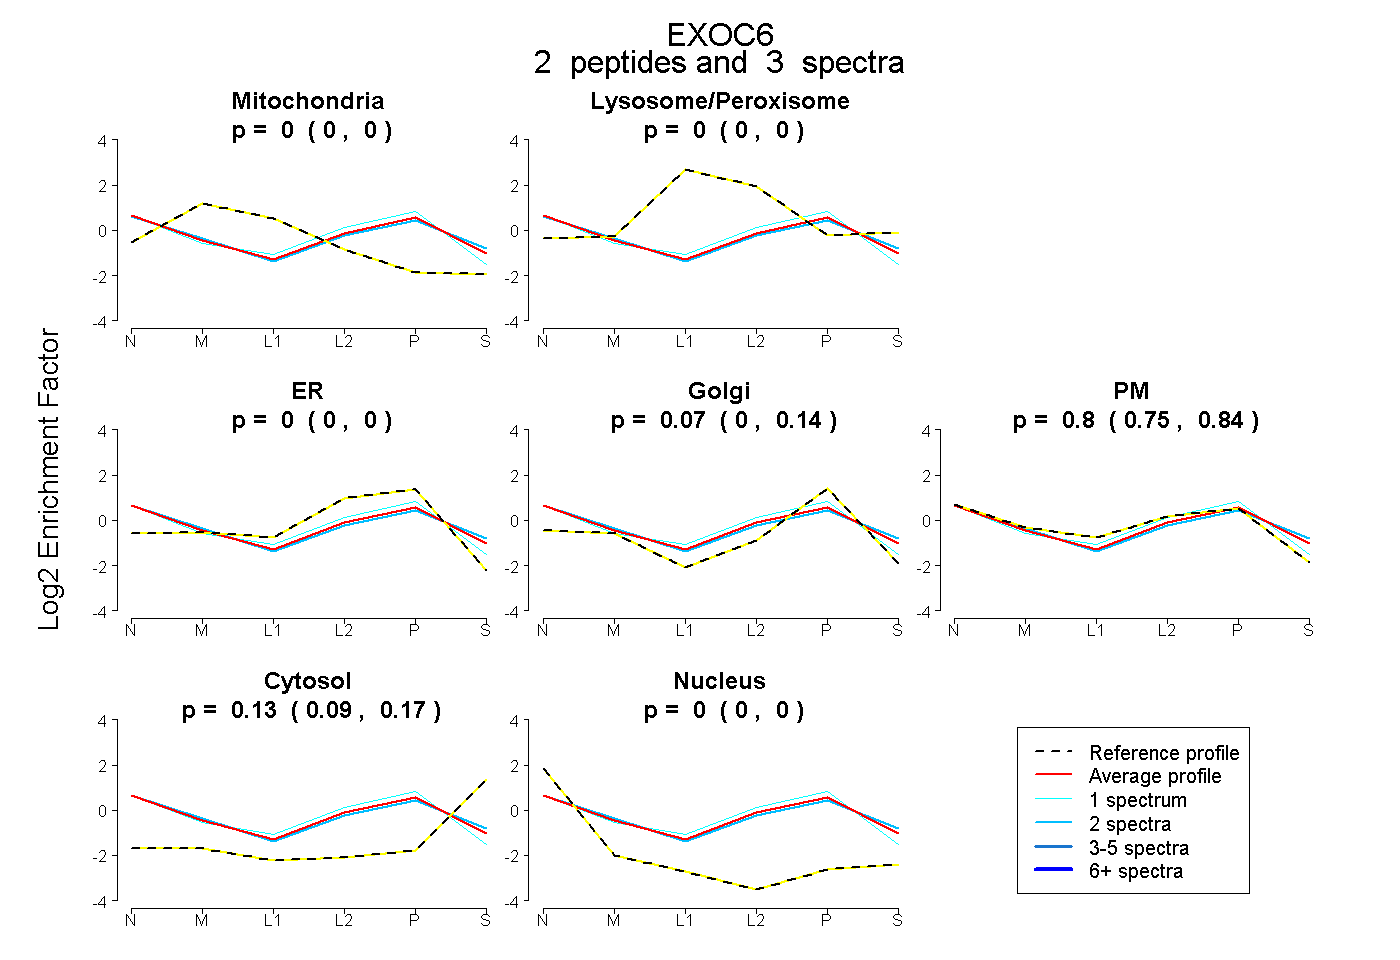 |
0.000 0.000 | 0.000 |
0.000 0.000 | 0.000 |
0.000 0.000 | 0.000 |
0.070 0.002 | 0.137 |
0.801 0.746 | 0.840 |
0.129 0.086 | 0.165 |
0.000 0.000 | 0.000 |
|||
| Plot | Lyso | Other | |||||||||||
| Expt C |
9 peptides |
14 spectra |
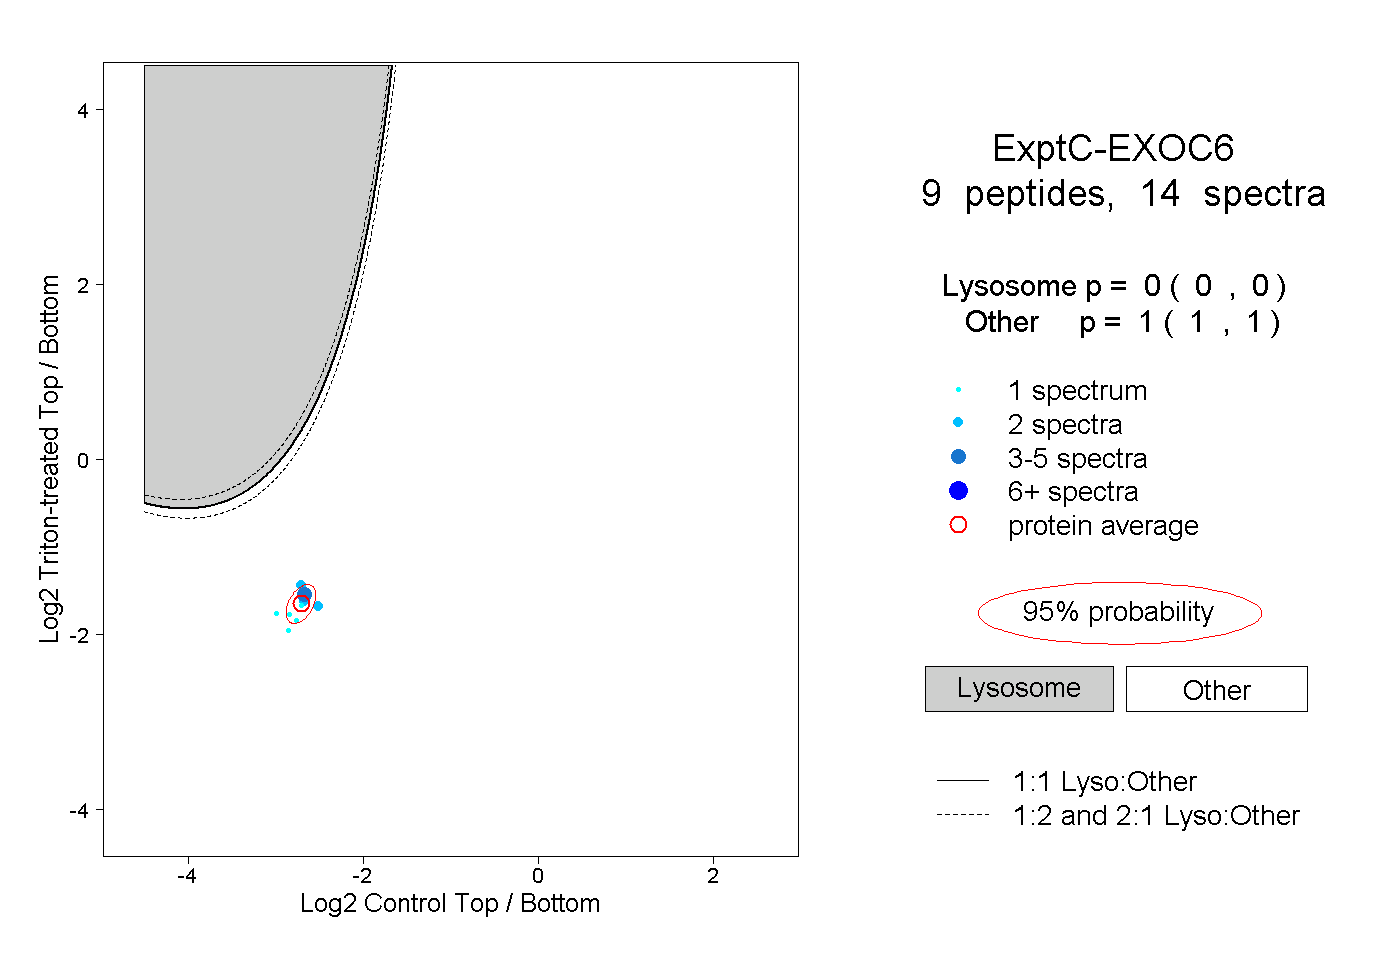 |
0.000 0.000 | 0.000 |
1.000 1.000 | 1.000 |
||||||||
| Plot | Lyso | Other | |||||||||||
| Expt D |
2 peptides |
2 spectra |
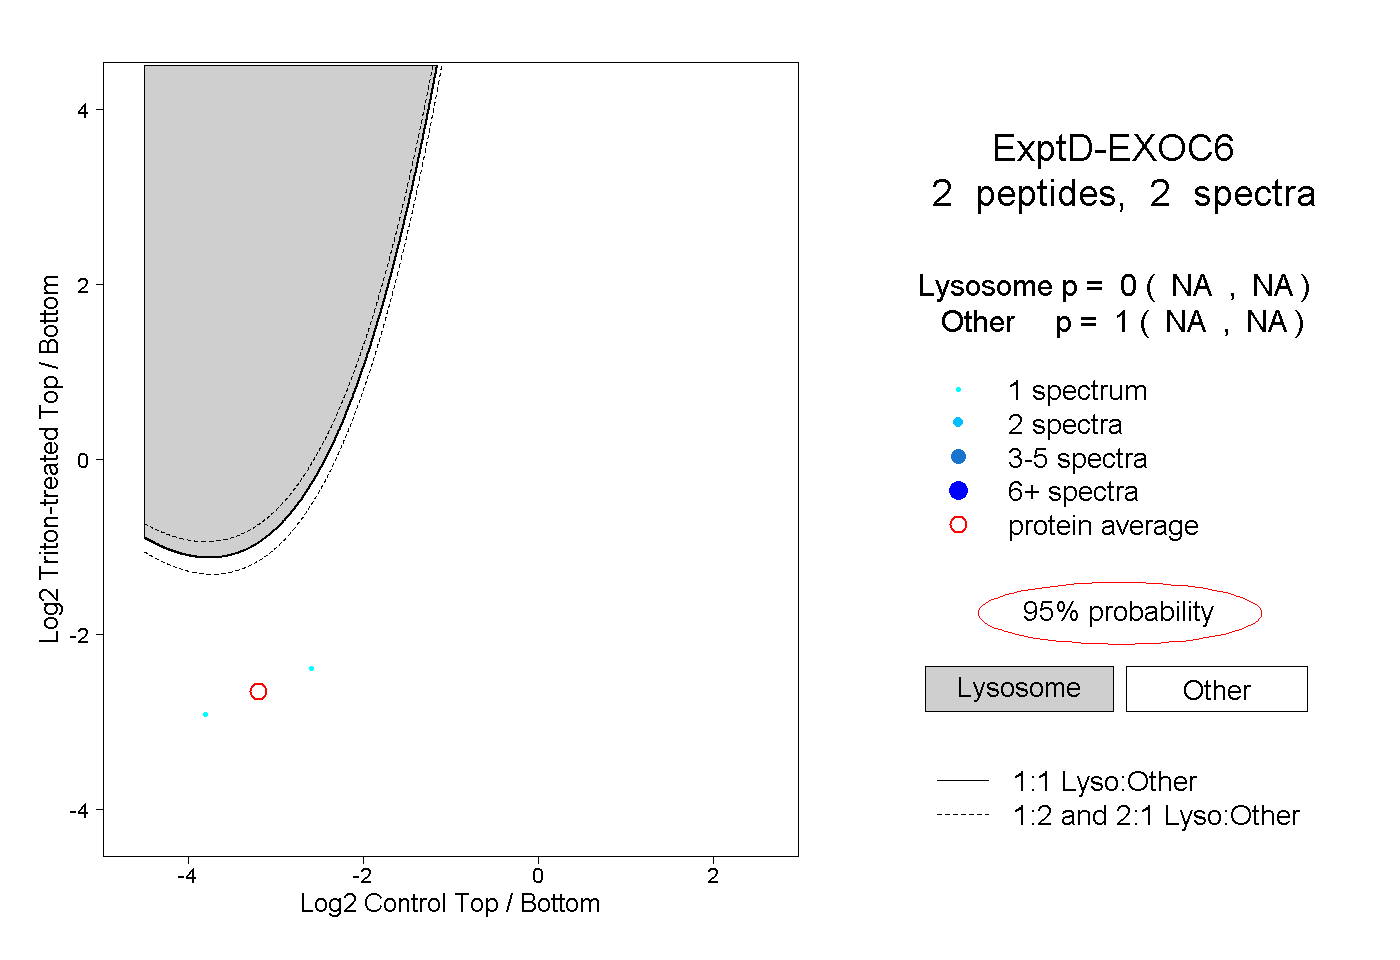 |
0.000 NA | NA |
1.000 NA | NA |