 31
31peptides
spectra
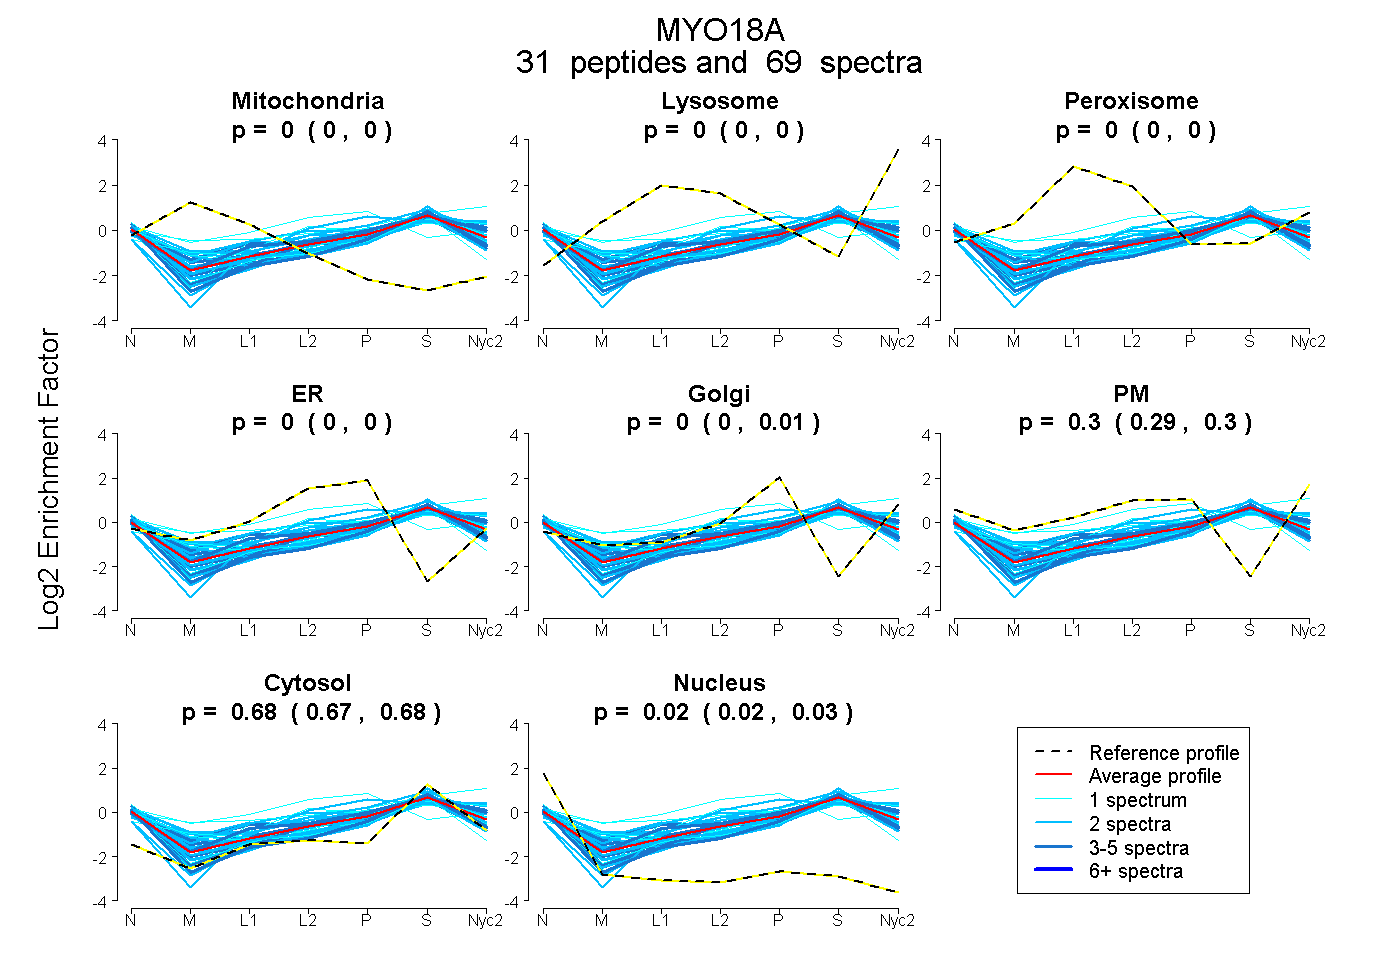
0.000 | 0.000
0.000 | 0.000
0.000 | 0.000
0.000 | 0.000
0.000 | 0.005
0.293 | 0.301
0.675 | 0.678
0.022 | 0.026
5peptides
spectra
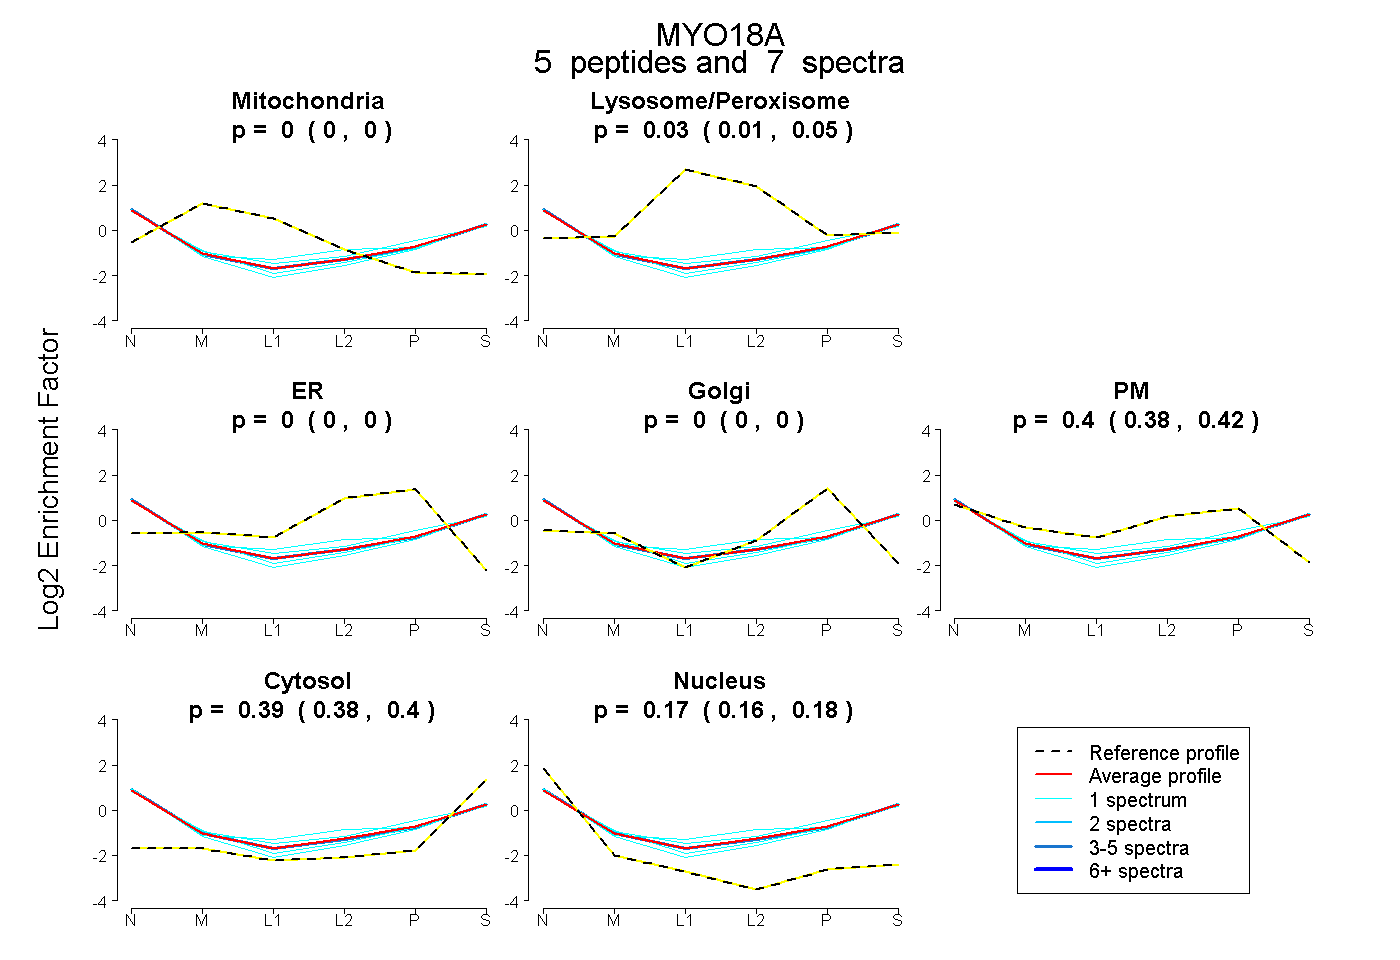
0.000 | 0.000
0.011 | 0.051
0.000 | 0.000
0.000 | 0.000
0.379 | 0.424
0.383 | 0.402
0.158 | 0.183
17peptides
spectra
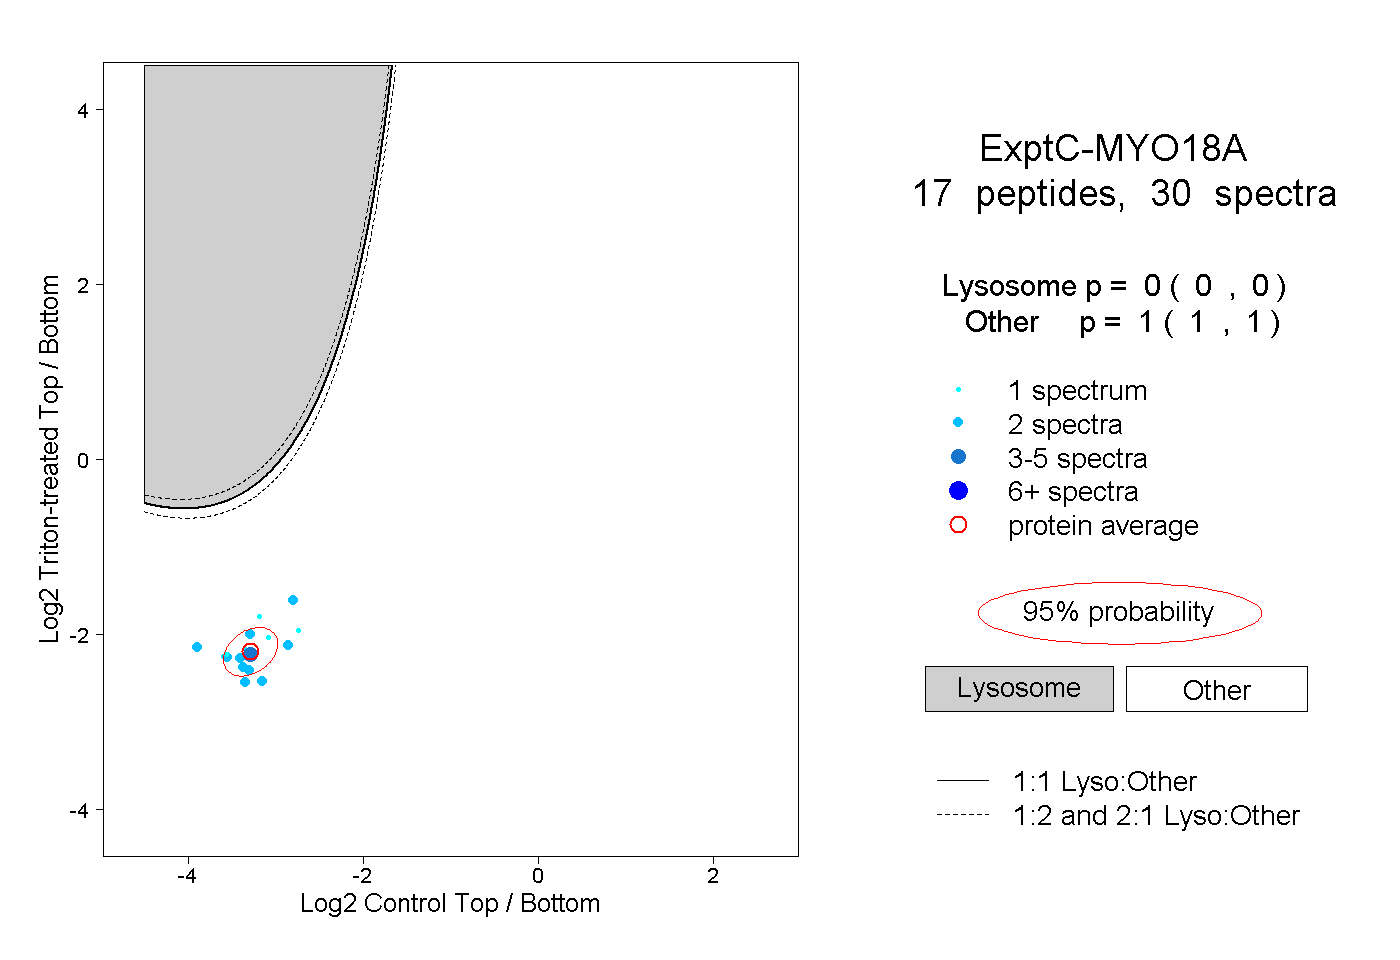
0.000 | 0.000
1.000 | 1.000
3peptides
spectra
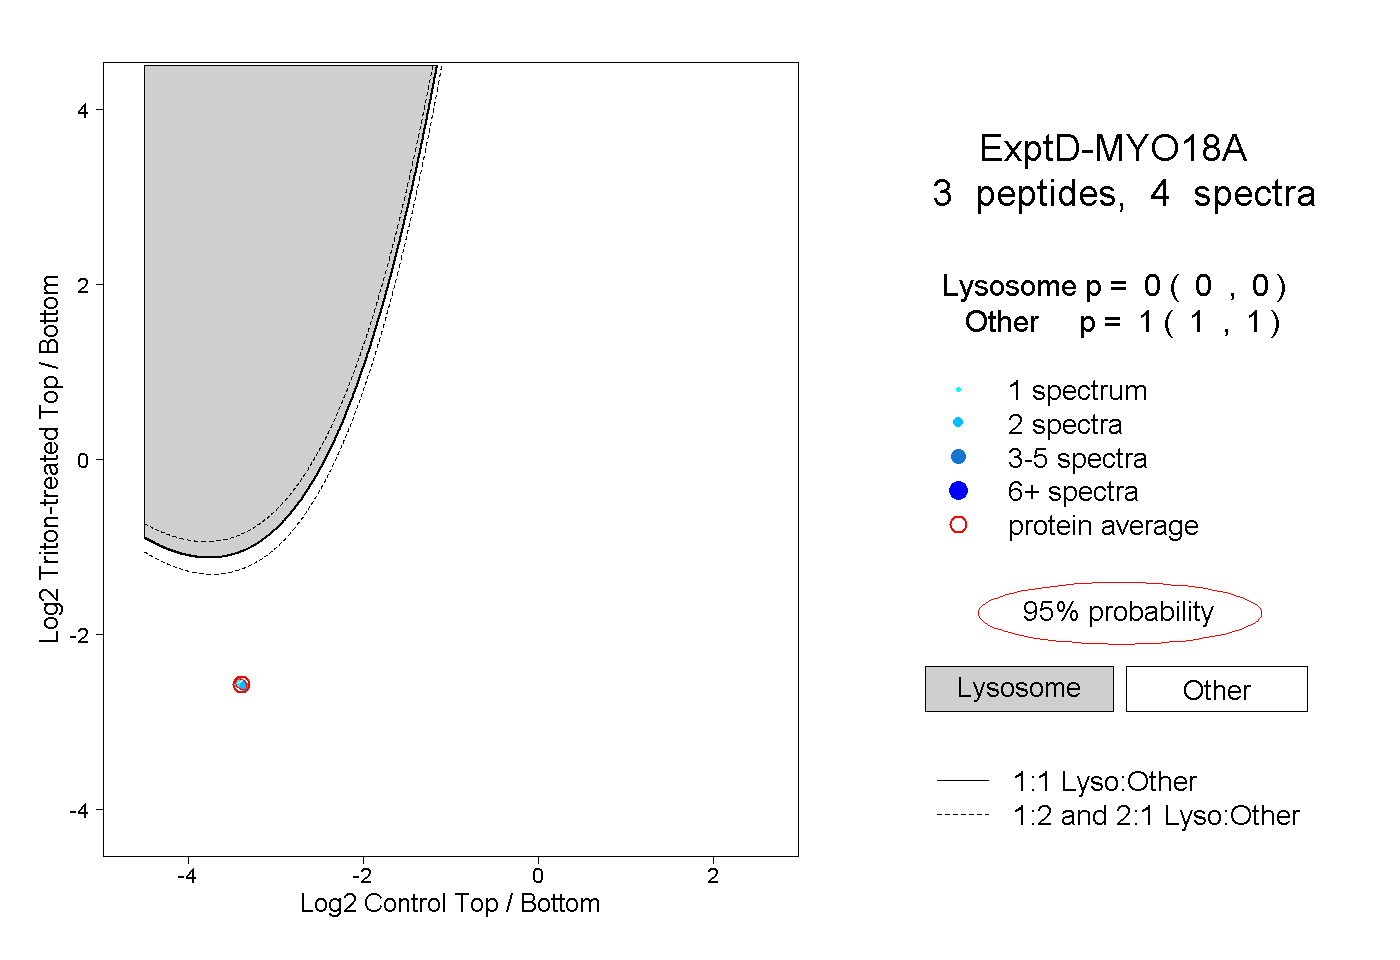
0.000 | 0.000
1.000 | 1.000