 3
3peptides
spectra
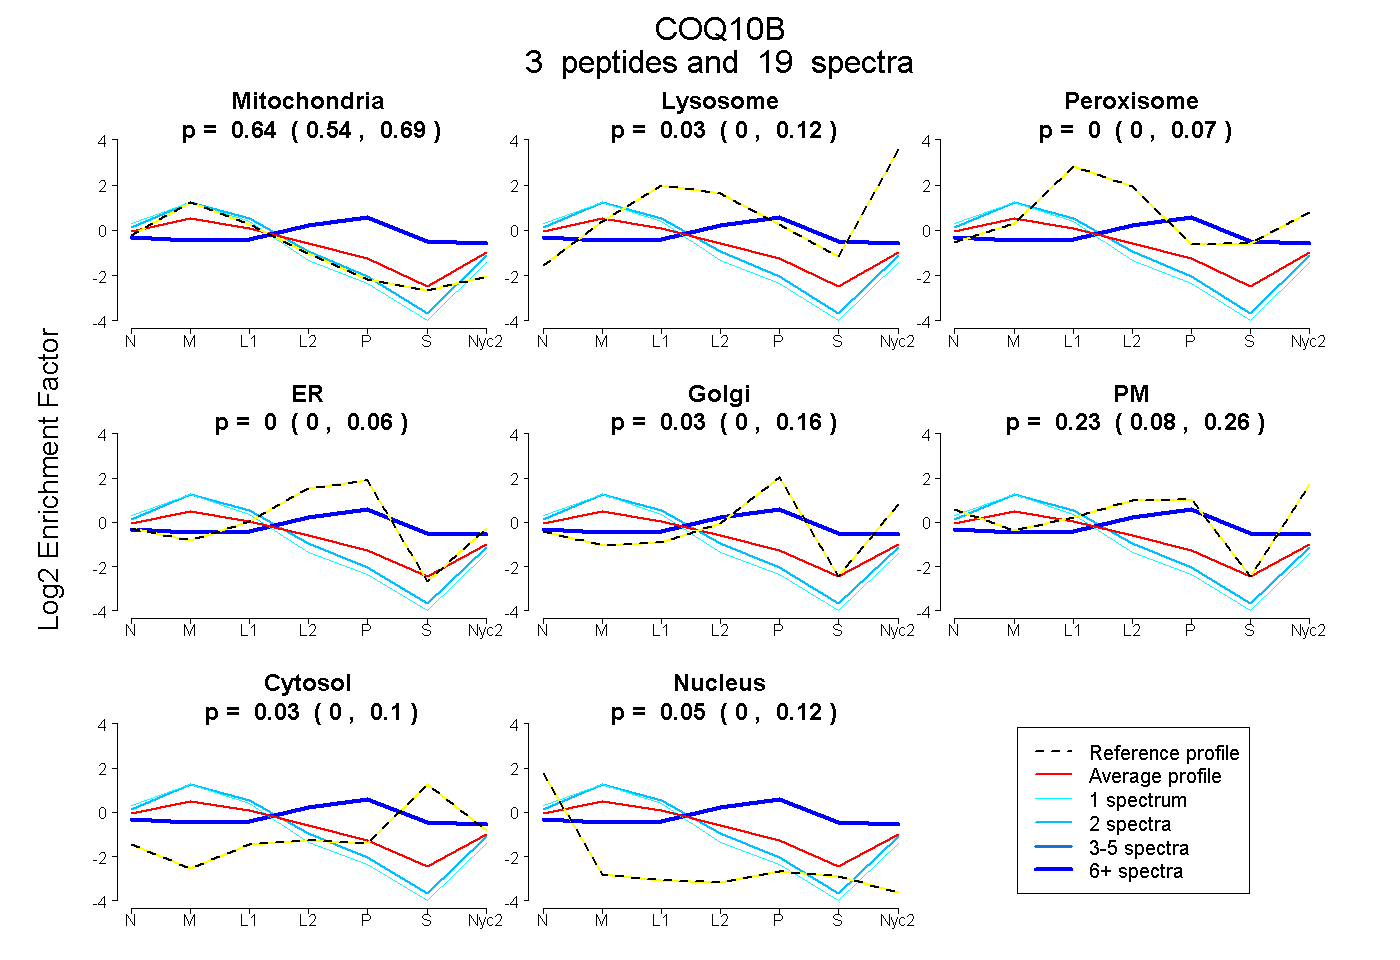
0.538 | 0.694
0.000 | 0.120
0.000 | 0.075
0.000 | 0.061
0.000 | 0.160
0.080 | 0.259
0.000 | 0.103
0.000 | 0.124
1peptide
spectra
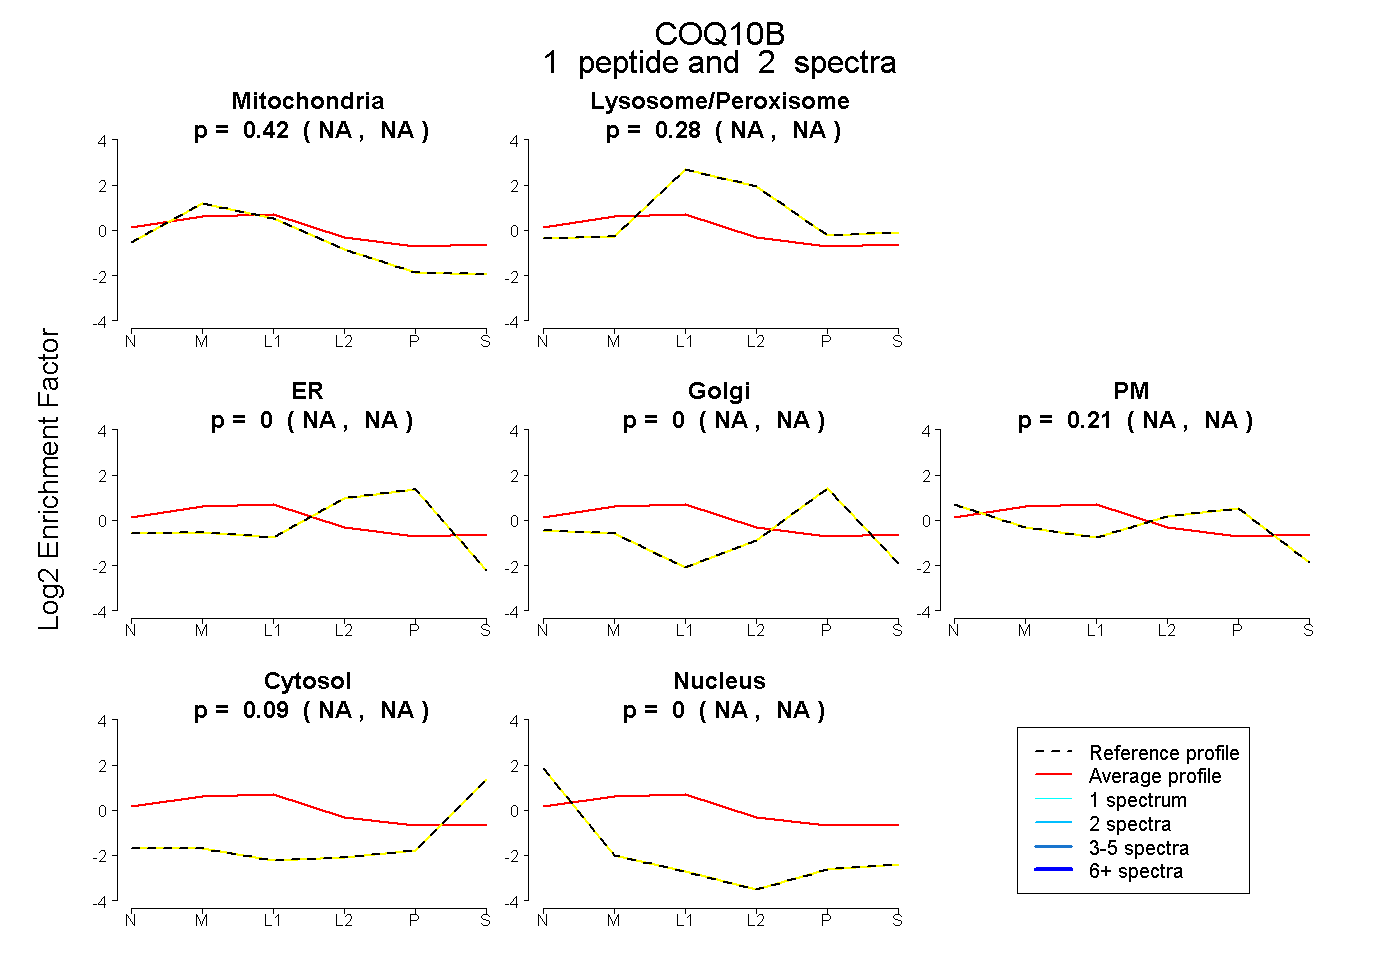
NA | NA
NA | NA
NA | NA
NA | NA
NA | NA
NA | NA
NA | NA
7peptides
spectra
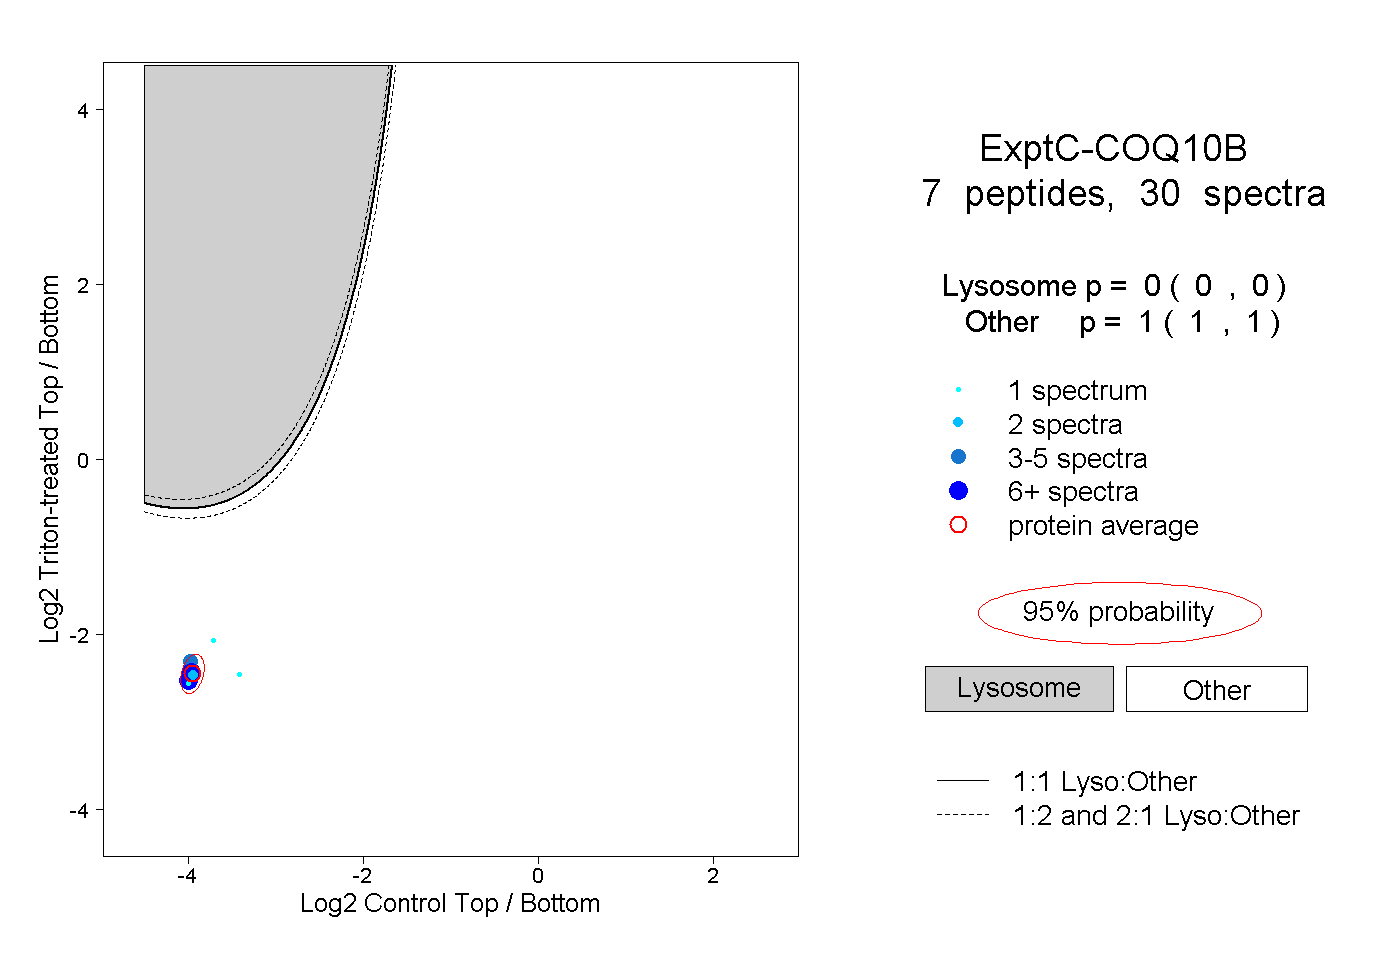
0.000 | 0.000
1.000 | 1.000
2peptides
spectra
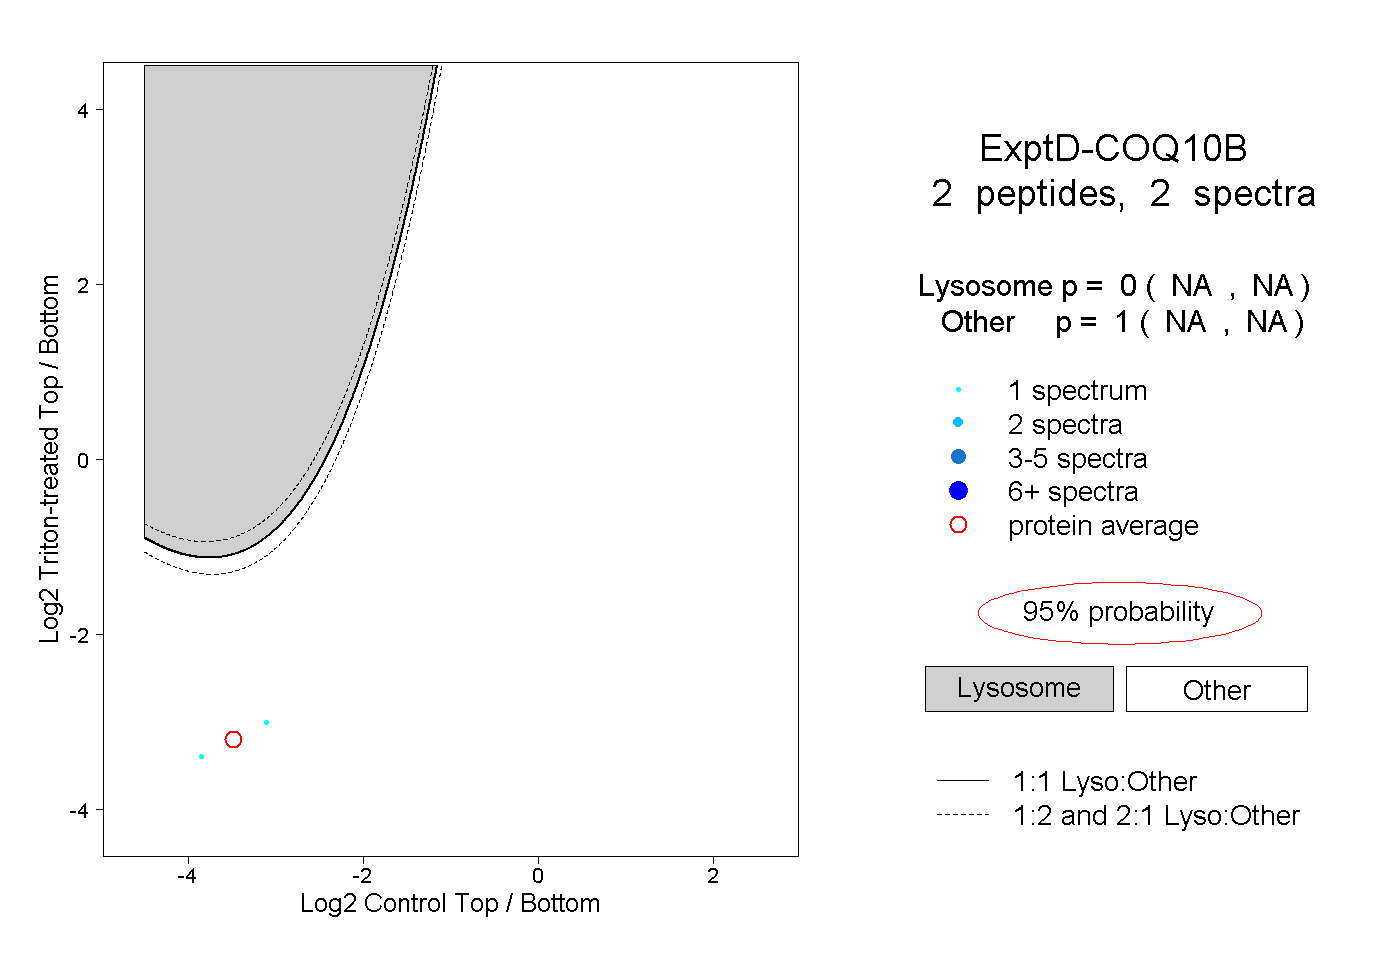
NA | NA
NA | NA