 3
3peptides
spectra
0.538 | 0.694
0.000 | 0.120
0.000 | 0.075
0.000 | 0.061
0.000 | 0.160
0.080 | 0.259
0.000 | 0.103
0.000 | 0.124
| Plot | Mito | Lyso | Perox | ER | Golgi | PM | Cytosol | Nucleus | |||||
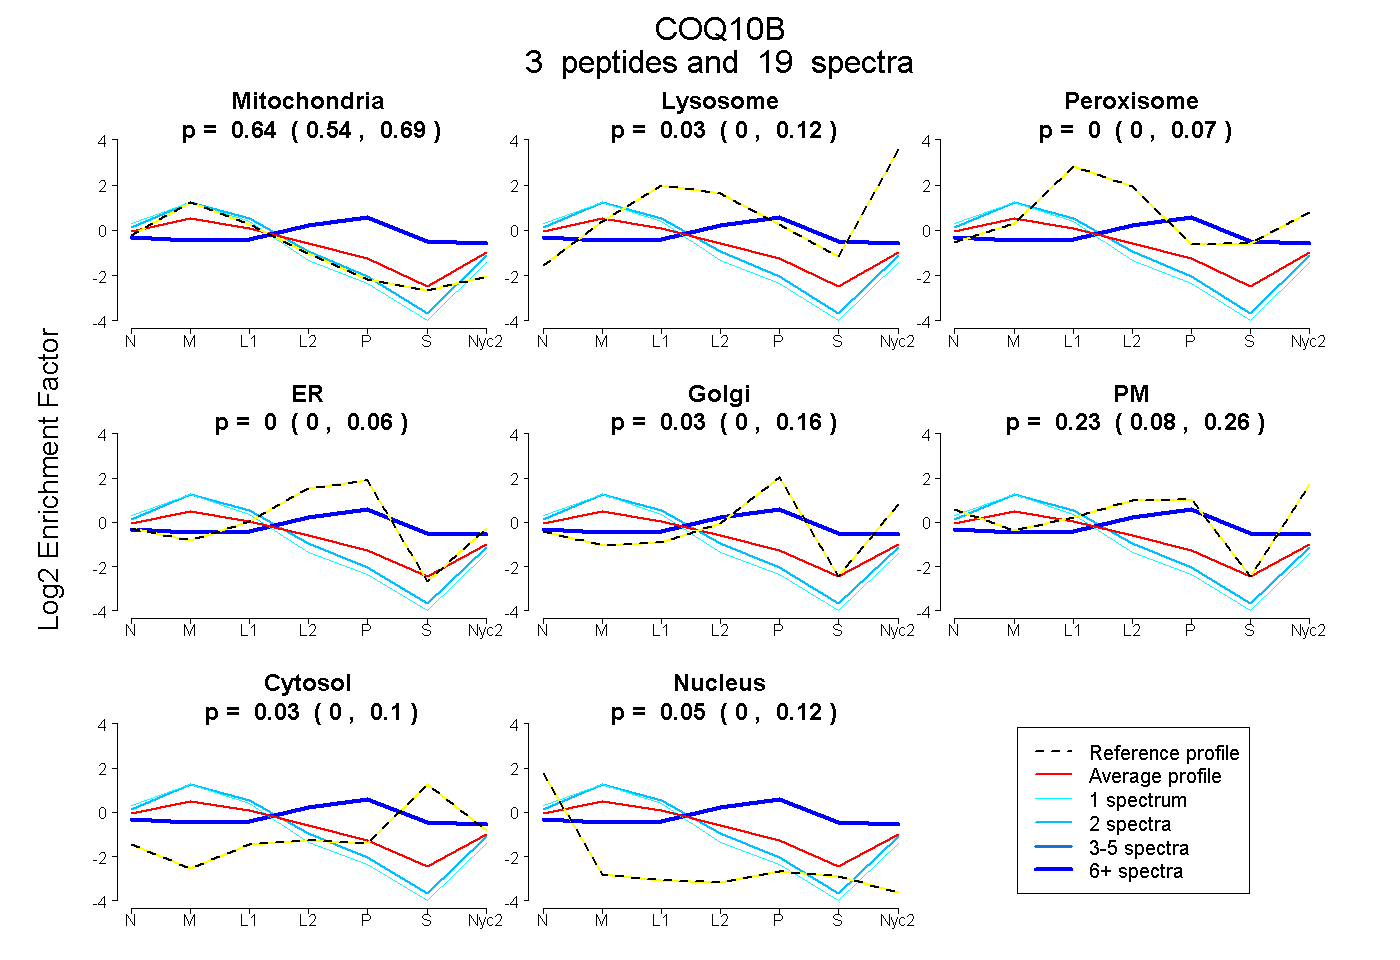
| Expt A |
3 peptides |
19 spectra |
|
0.644 0.538 | 0.694 |
0.026 0.000 | 0.120 |
0.000 0.000 | 0.075 |
0.000 0.000 | 0.061 |
0.031 0.000 | 0.160 |
0.227 0.080 | 0.259 |
0.027 0.000 | 0.103 |
0.046 0.000 | 0.124 |
| 2 spectra, FSPGLPGYPR | 0.867 | 0.000 | 0.000 | 0.000 | 0.000 | 0.133 | 0.000 | 0.000 | ||
| 1 spectrum, LFNHLETVWR | 0.933 | 0.000 | 0.000 | 0.000 | 0.000 | 0.043 | 0.000 | 0.024 | ||
| 16 spectra, IMAAR | 0.091 | 0.000 | 0.122 | 0.339 | 0.122 | 0.000 | 0.326 | 0.000 |
| Plot | Mito | Lyso or Perox | ER | Golgi | PM | Cytosol | Nucleus | ||||||
| Expt B |
1 peptide |
2 spectra |
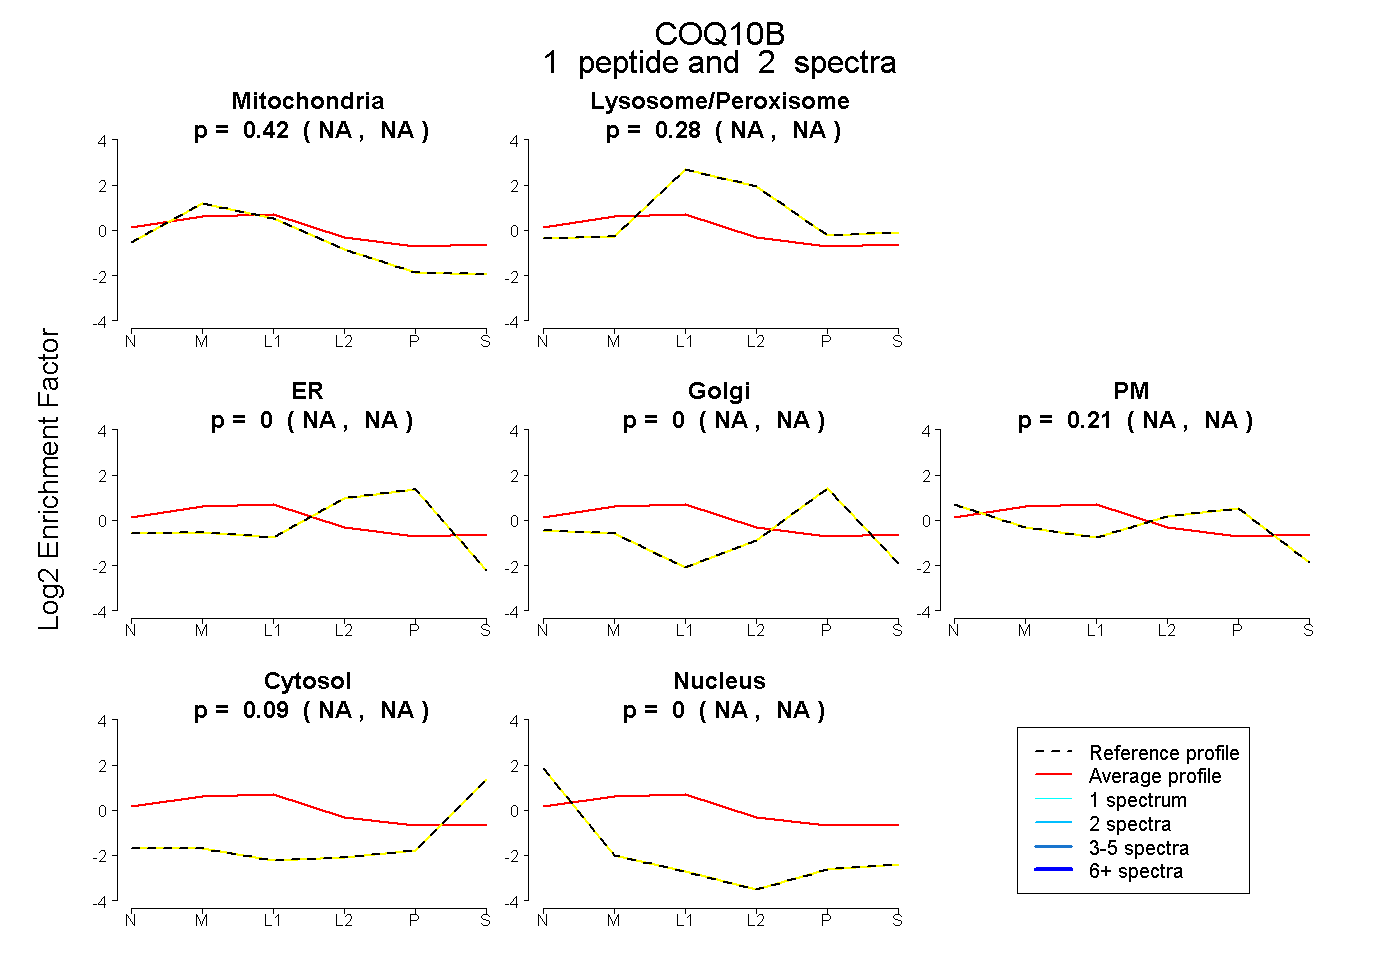 |
0.415 NA | NA |
0.279 NA | NA |
0.000 NA | NA |
0.000 NA | NA |
0.211 NA | NA |
0.094 NA | NA |
0.001 NA | NA |
|||
| Plot | Lyso | Other | |||||||||||
| Expt C |
7 peptides |
30 spectra |
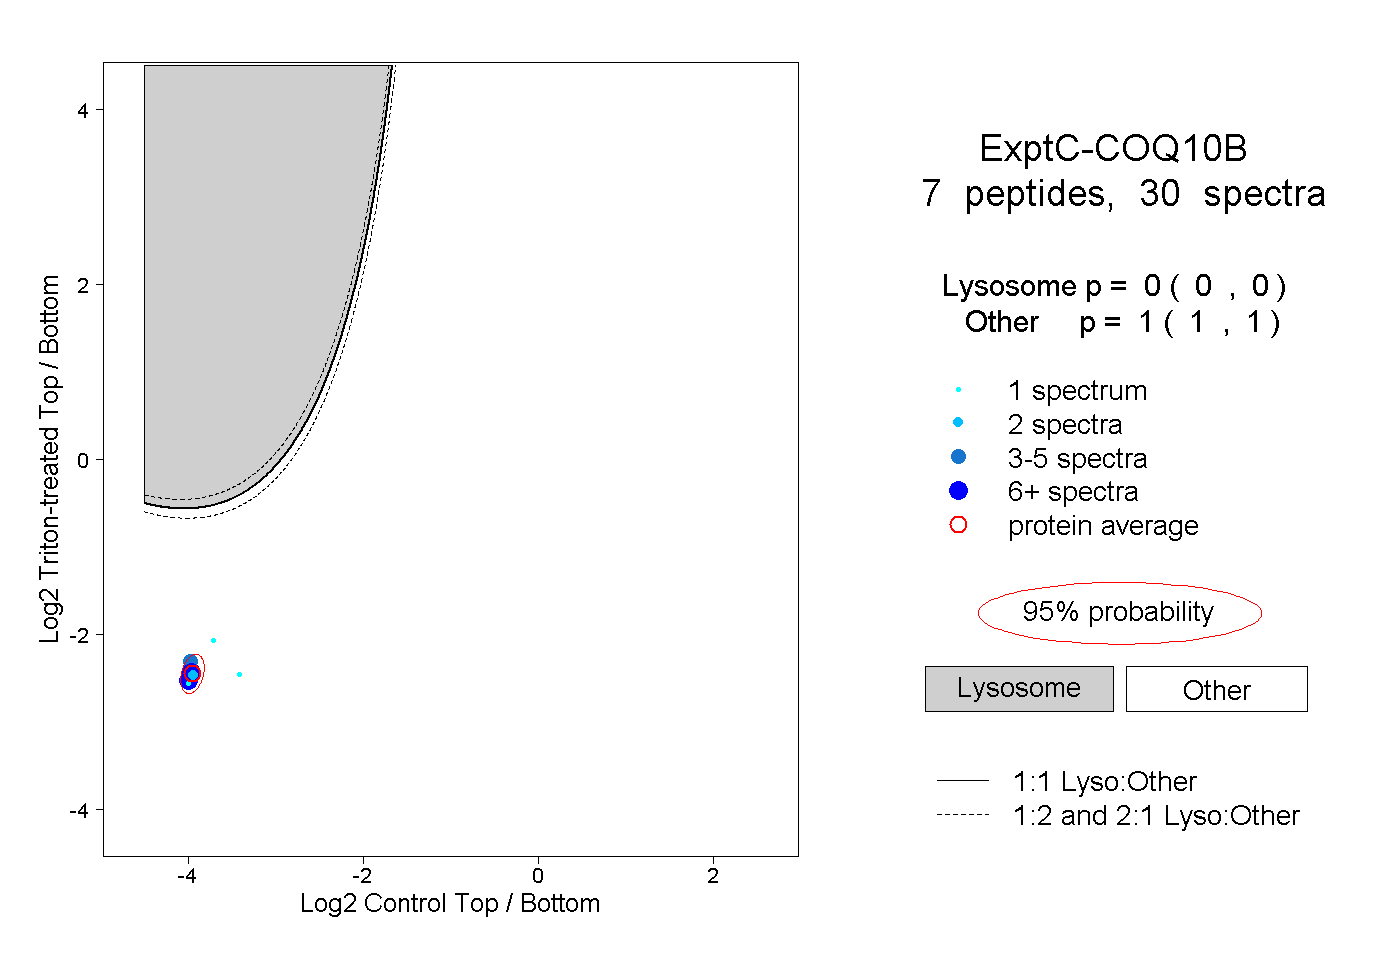 |
0.000 0.000 | 0.000 |
1.000 1.000 | 1.000 |
||||||||
| Plot | Lyso | Other | |||||||||||
| Expt D |
2 peptides |
2 spectra |
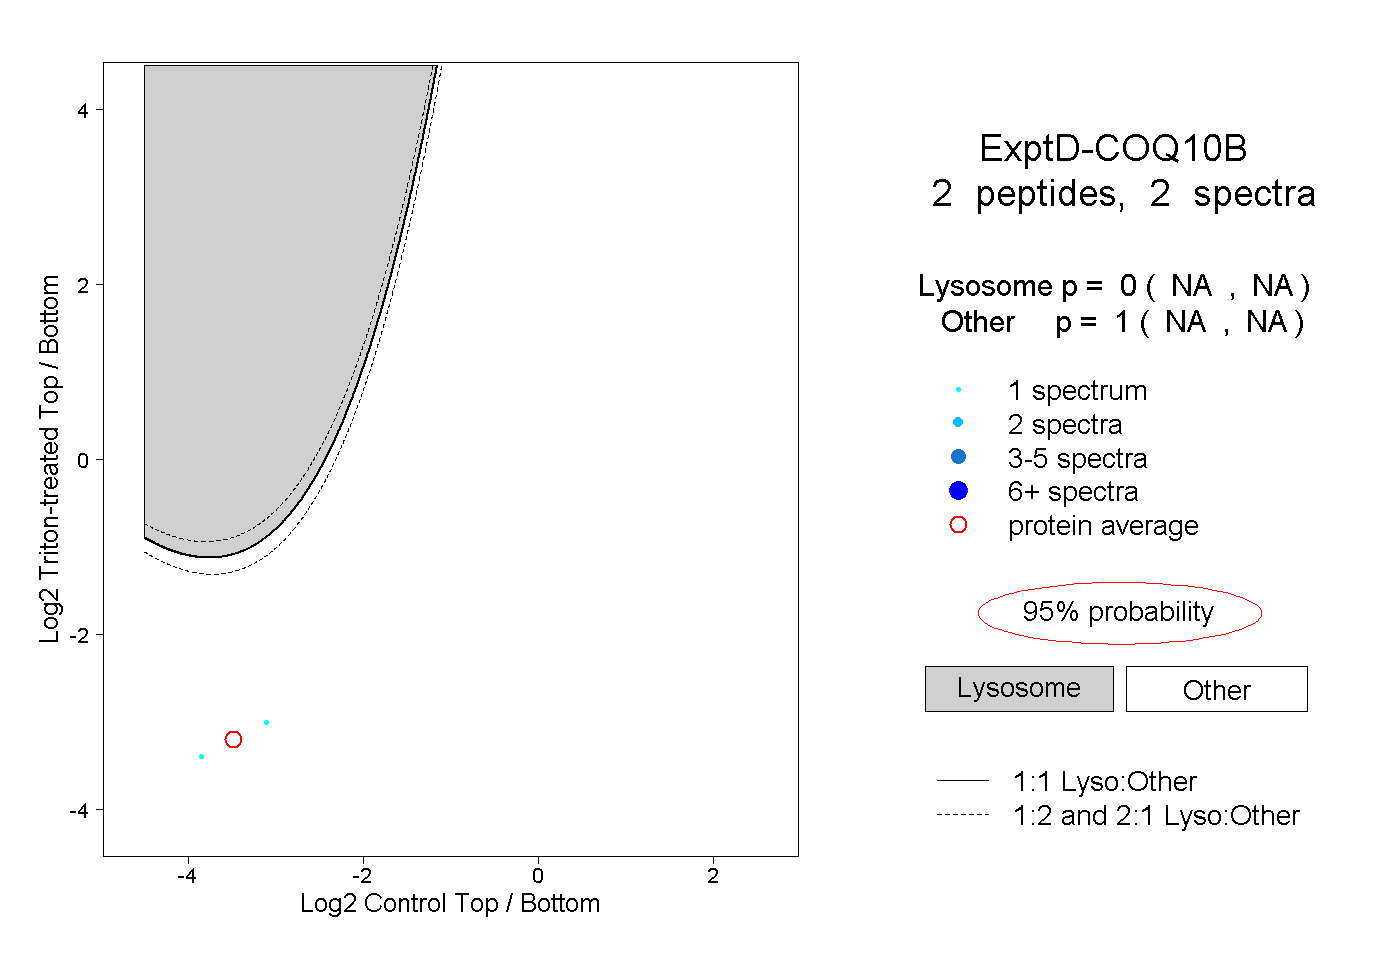 |
0.000 NA | NA |
1.000 NA | NA |