 5
5peptides
spectra
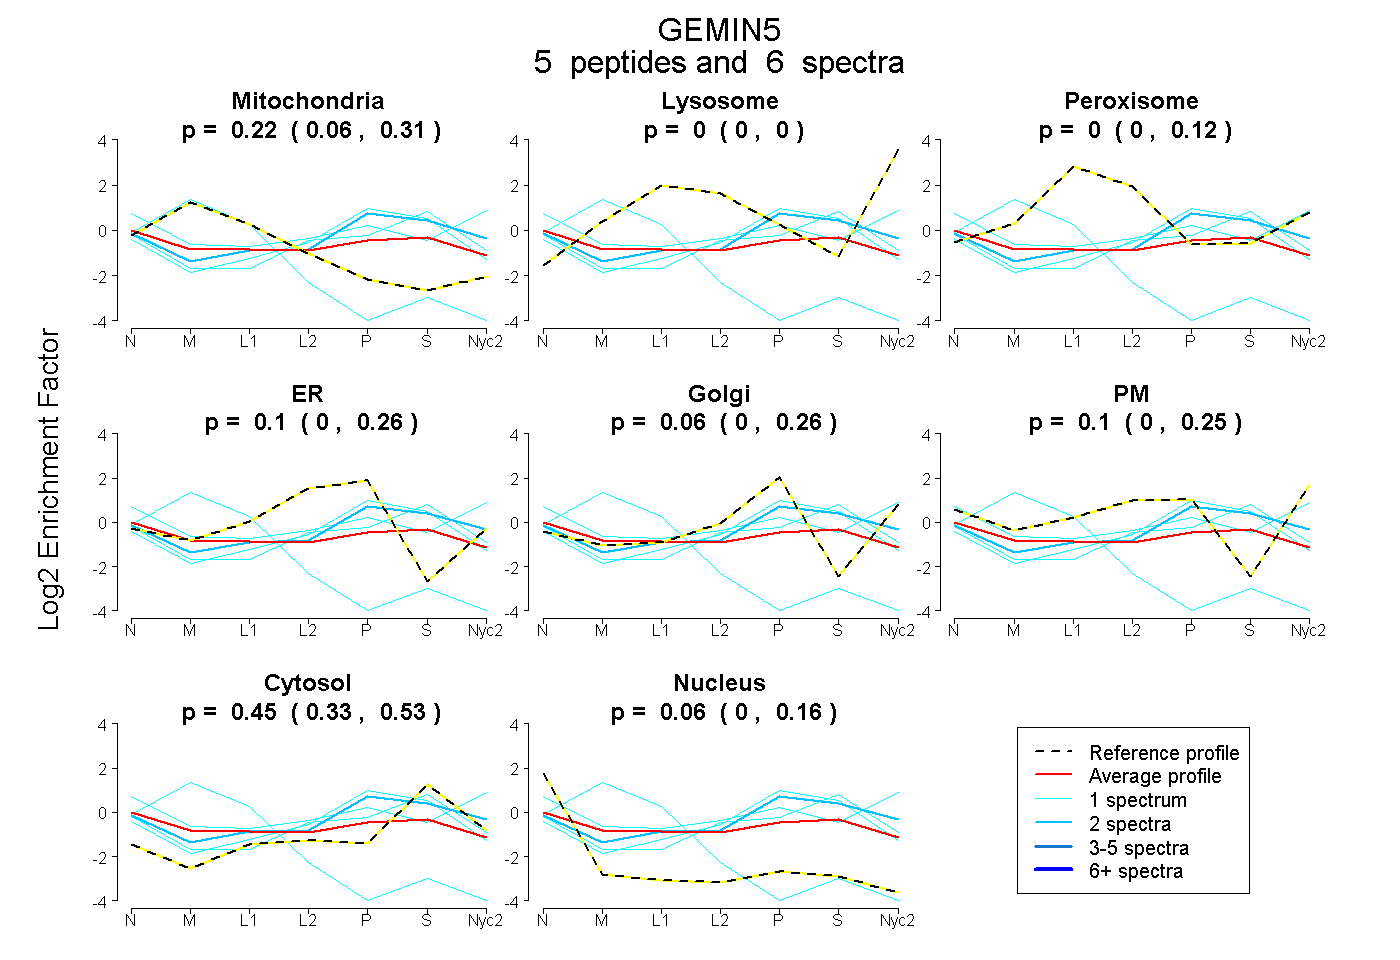
0.061 | 0.311
0.000 | 0.000
0.000 | 0.118
0.000 | 0.259
0.000 | 0.260
0.000 | 0.252
0.329 | 0.527
0.002 | 0.165
1peptide
spectra
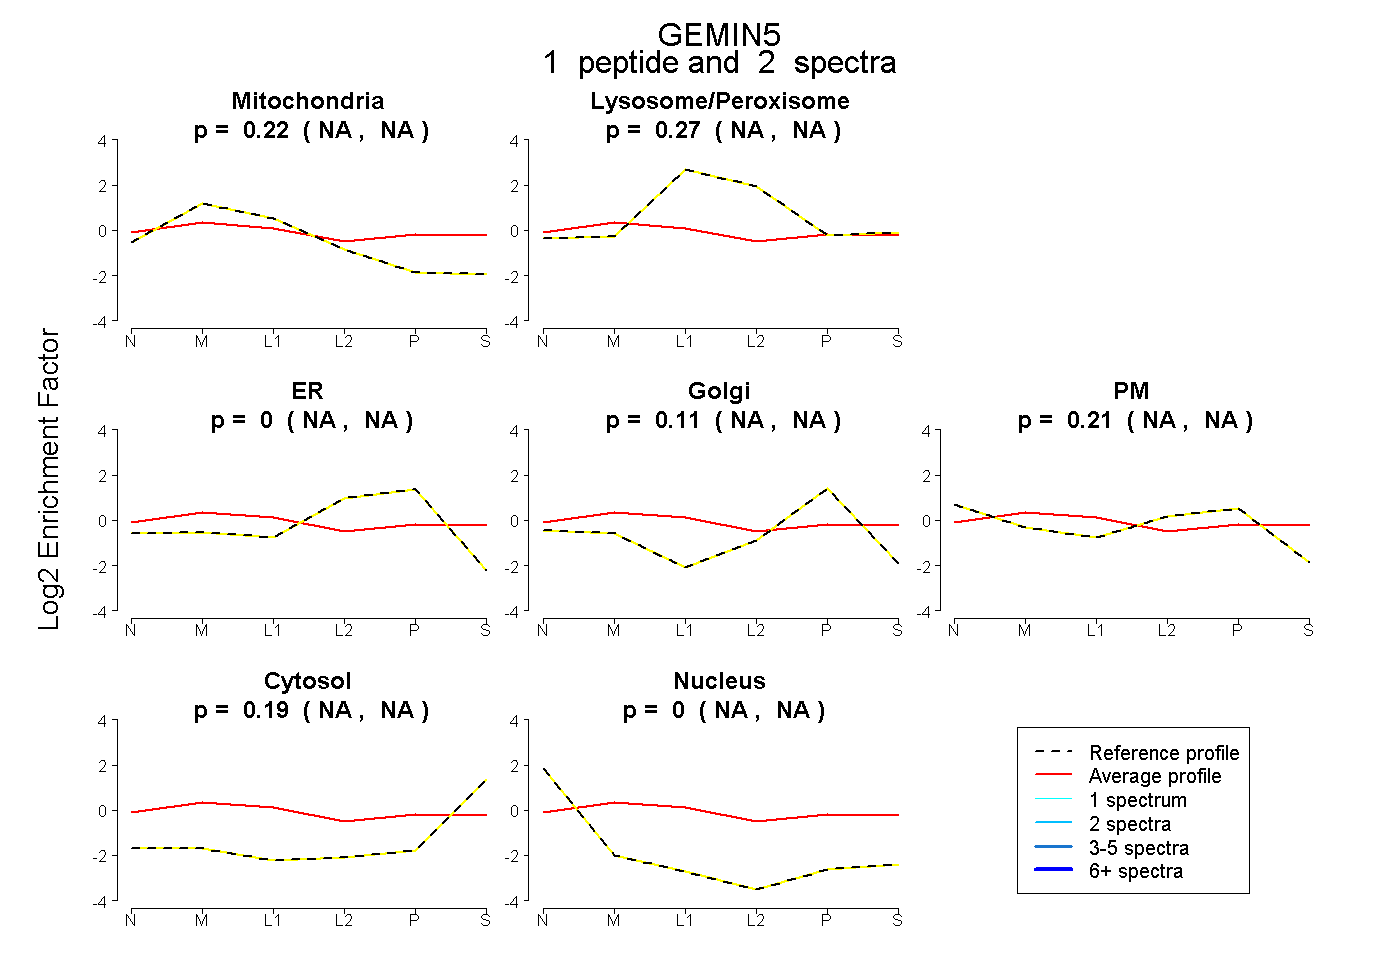
NA | NA
NA | NA
NA | NA
NA | NA
NA | NA
NA | NA
NA | NA
4peptides
spectra
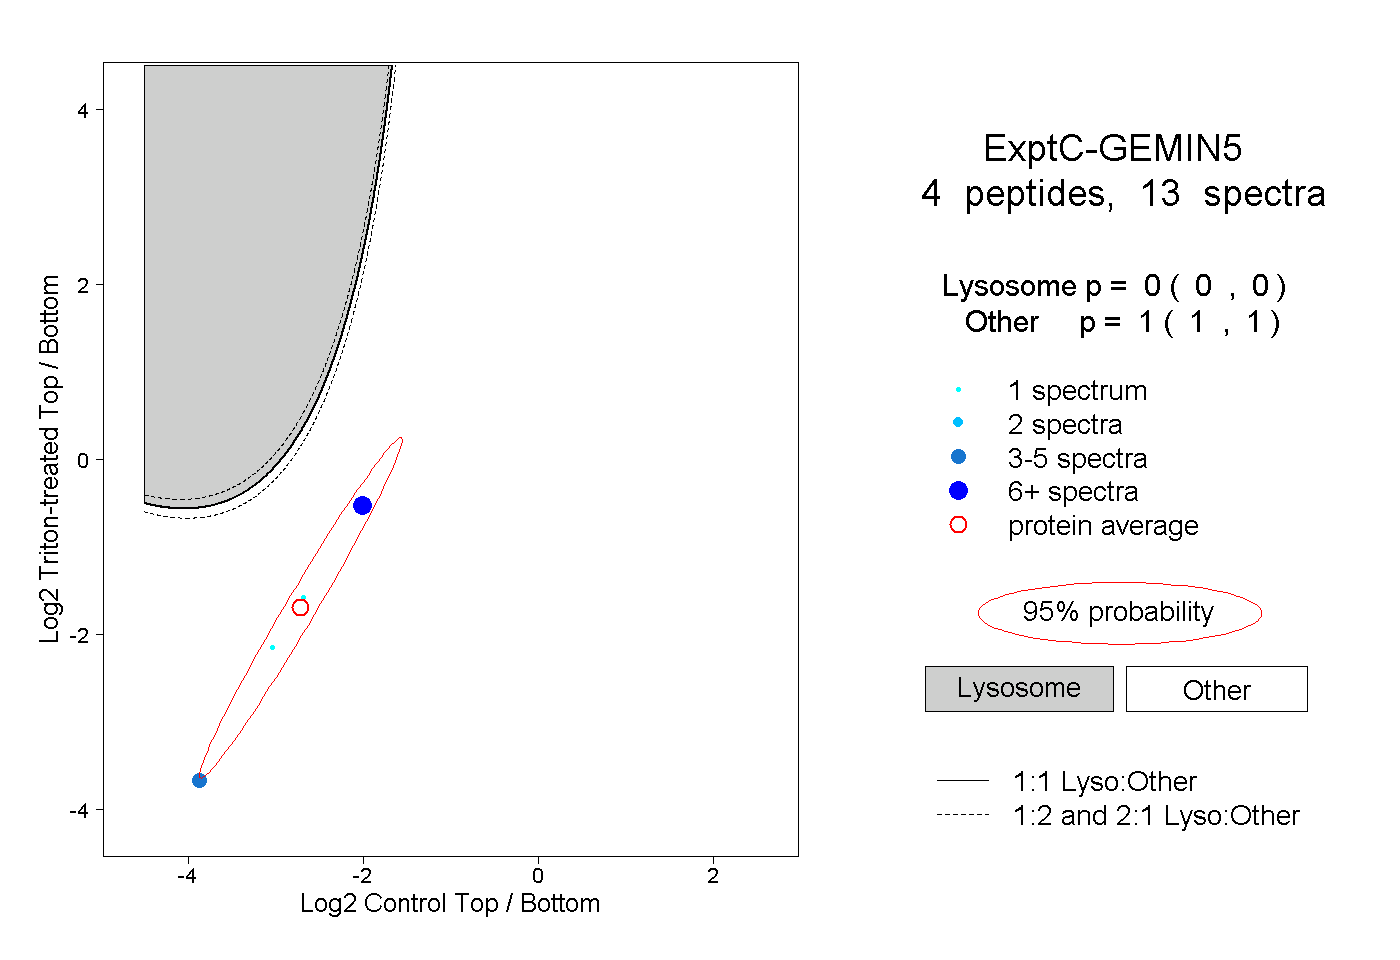
0.000 | 0.000
1.000 | 1.000