 5
5peptides
spectra
0.061 | 0.311
0.000 | 0.000
0.000 | 0.118
0.000 | 0.259
0.000 | 0.260
0.000 | 0.252
0.329 | 0.527
0.002 | 0.165
| Plot | Mito | Lyso | Perox | ER | Golgi | PM | Cytosol | Nucleus | |||||
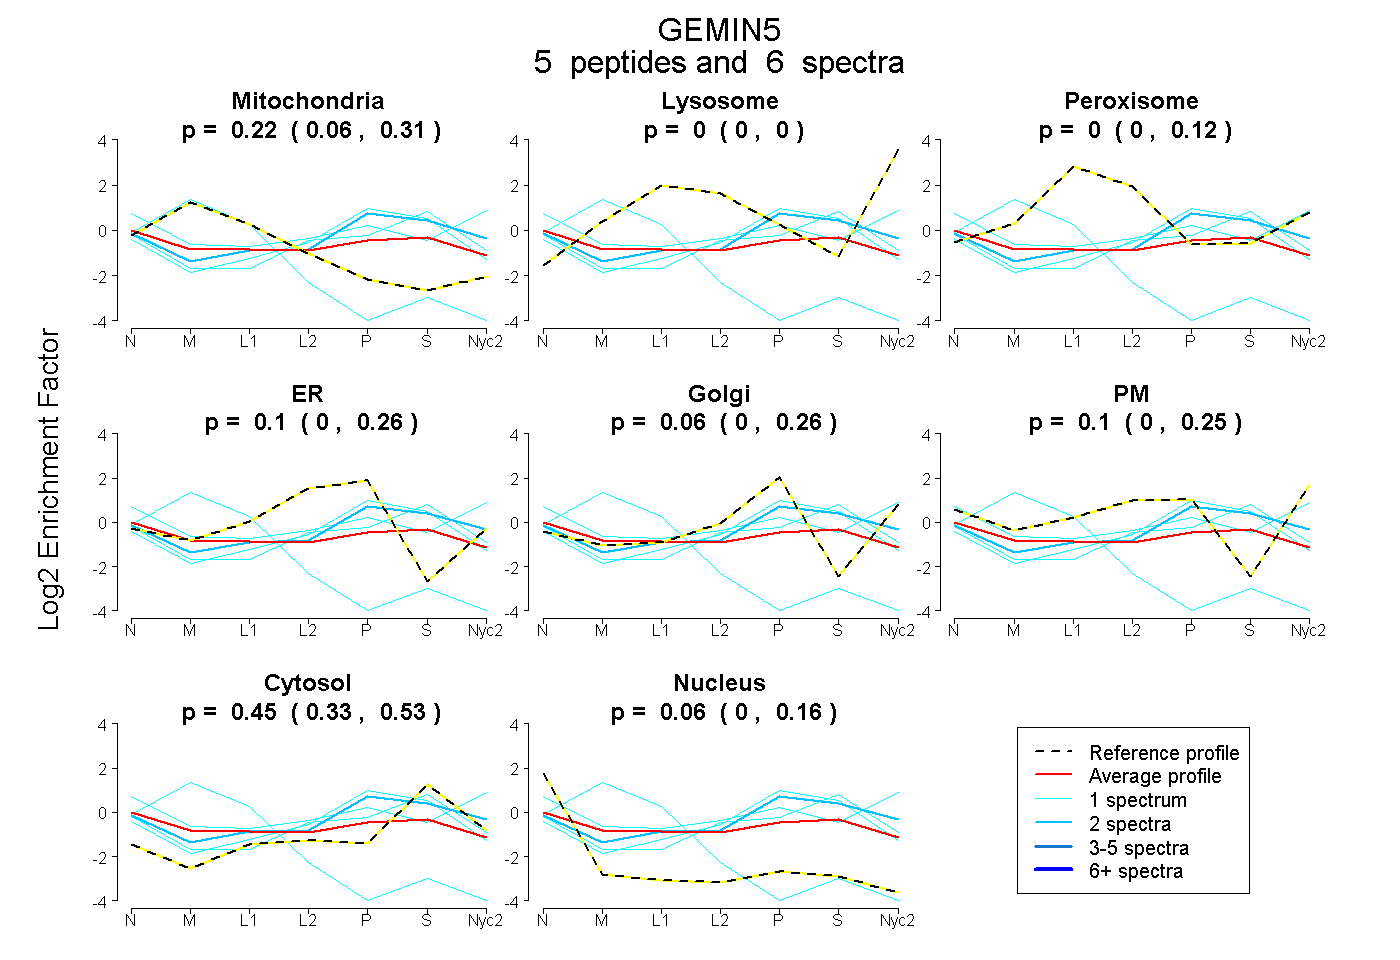
| Expt A |
5 peptides |
6 spectra |
|
0.222 0.061 | 0.311 |
0.000 0.000 | 0.000 |
0.000 0.000 | 0.118 |
0.103 0.000 | 0.259 |
0.057 0.000 | 0.260 |
0.101 0.000 | 0.252 |
0.453 0.329 | 0.527 |
0.065 0.002 | 0.165 |
| 1 spectrum, CSDAAPGGIFGFAAR | 0.831 | 0.000 | 0.000 | 0.000 | 0.000 | 0.000 | 0.000 | 0.169 | ||
| 1 spectrum, LSGEAFDINK | 0.000 | 0.000 | 0.000 | 0.000 | 0.000 | 0.614 | 0.356 | 0.029 | ||
| 1 spectrum, EGCLAFGTDDGK | 0.000 | 0.000 | 0.000 | 0.192 | 0.000 | 0.057 | 0.710 | 0.040 | ||
| 2 spectra, VVGELVGHTER | 0.000 | 0.000 | 0.057 | 0.000 | 0.416 | 0.000 | 0.528 | 0.000 | ||
| 1 spectrum, LWLTLHWPK | 0.000 | 0.000 | 0.000 | 0.296 | 0.087 | 0.000 | 0.608 | 0.009 |
| Plot | Mito | Lyso or Perox | ER | Golgi | PM | Cytosol | Nucleus | ||||||
| Expt B |
1 peptide |
2 spectra |
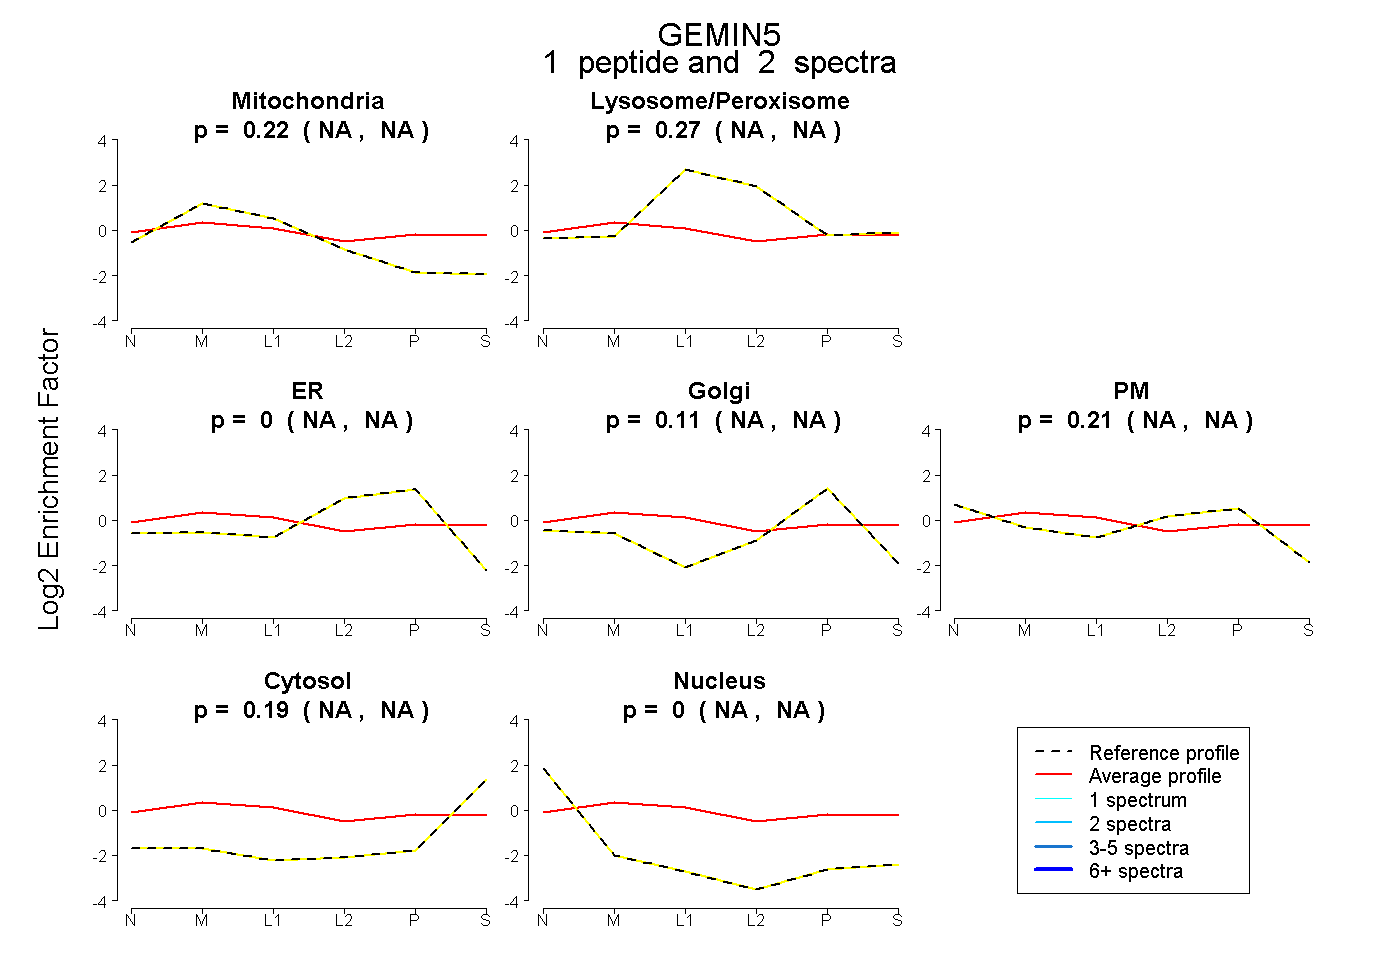 |
0.223 NA | NA |
0.269 NA | NA |
0.000 NA | NA |
0.111 NA | NA |
0.205 NA | NA |
0.192 NA | NA |
0.000 NA | NA |
|||
| Plot | Lyso | Other | |||||||||||
| Expt C |
4 peptides |
13 spectra |
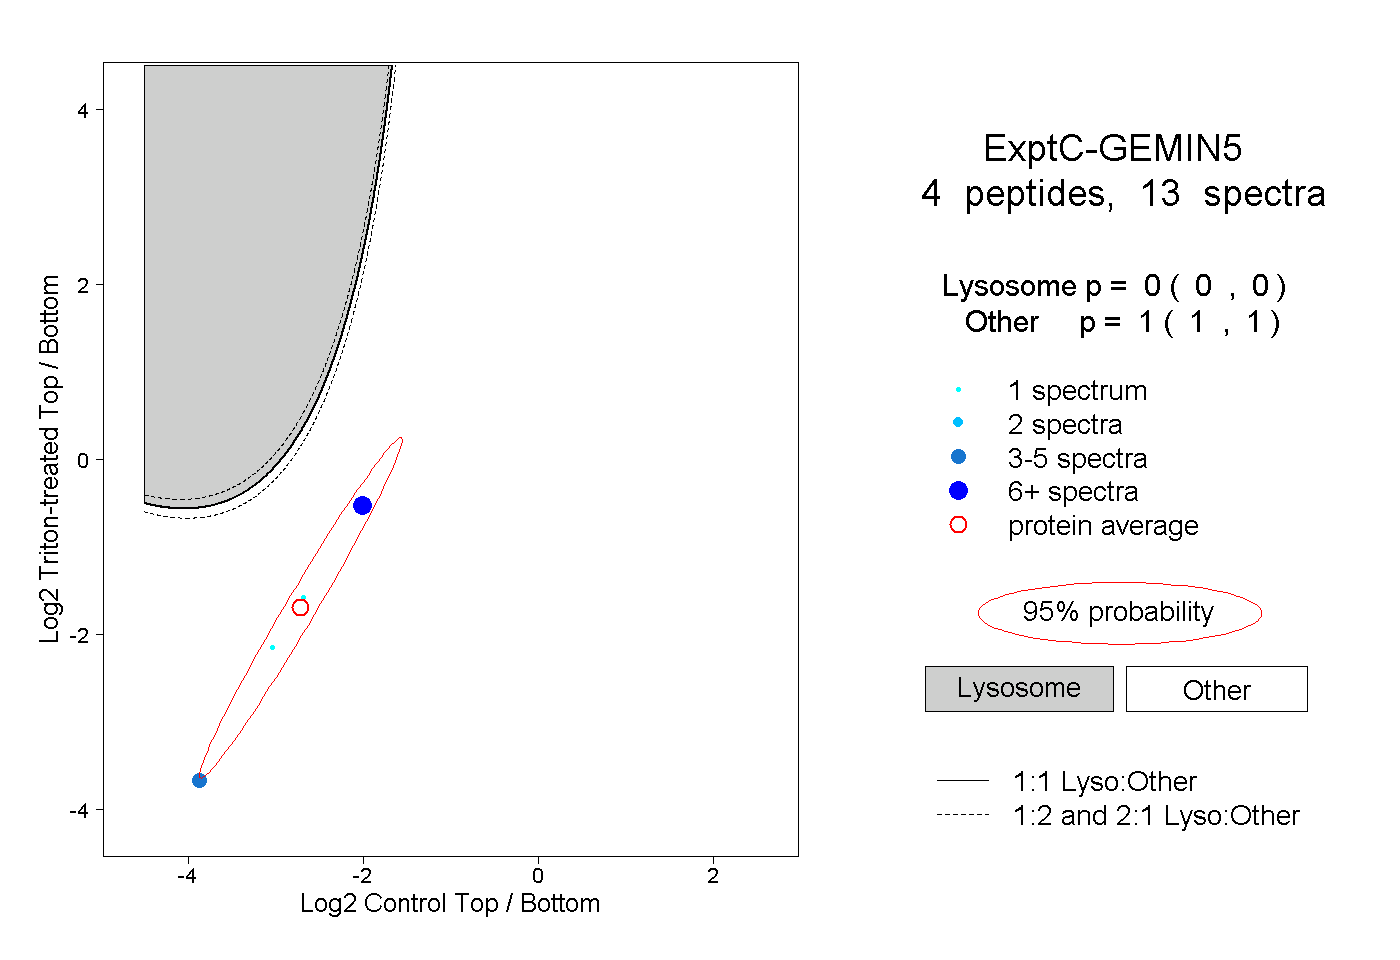 |
0.000 0.000 | 0.000 |
1.000 1.000 | 1.000 |