 6
6peptides
spectra
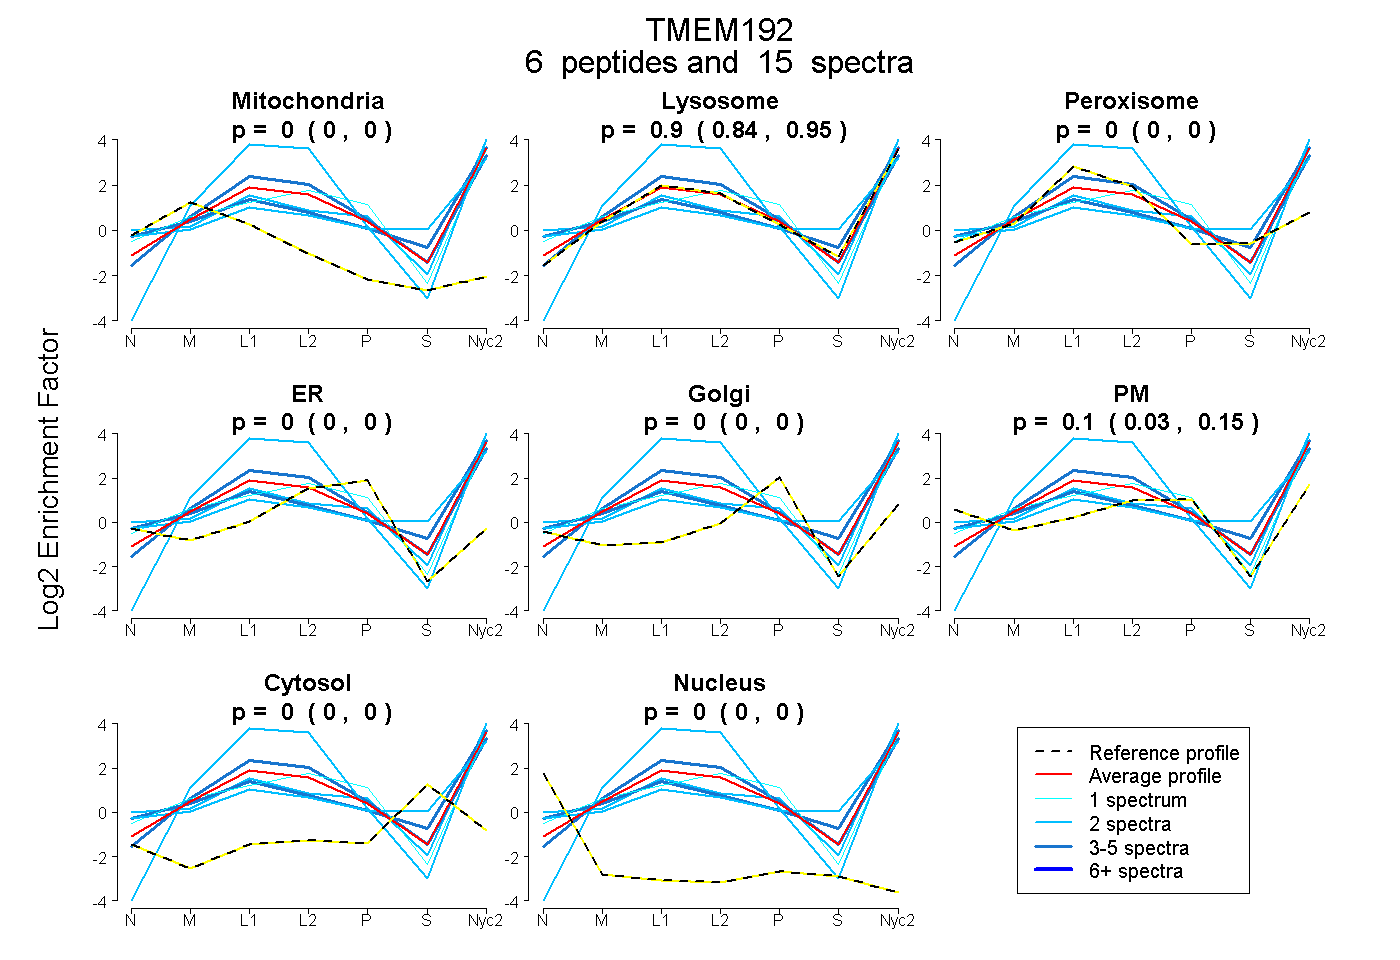
0.000 | 0.000
0.844 | 0.952
0.000 | 0.000
0.000 | 0.000
0.000 | 0.000
0.033 | 0.147
0.000 | 0.000
0.000 | 0.000
3peptides
spectra
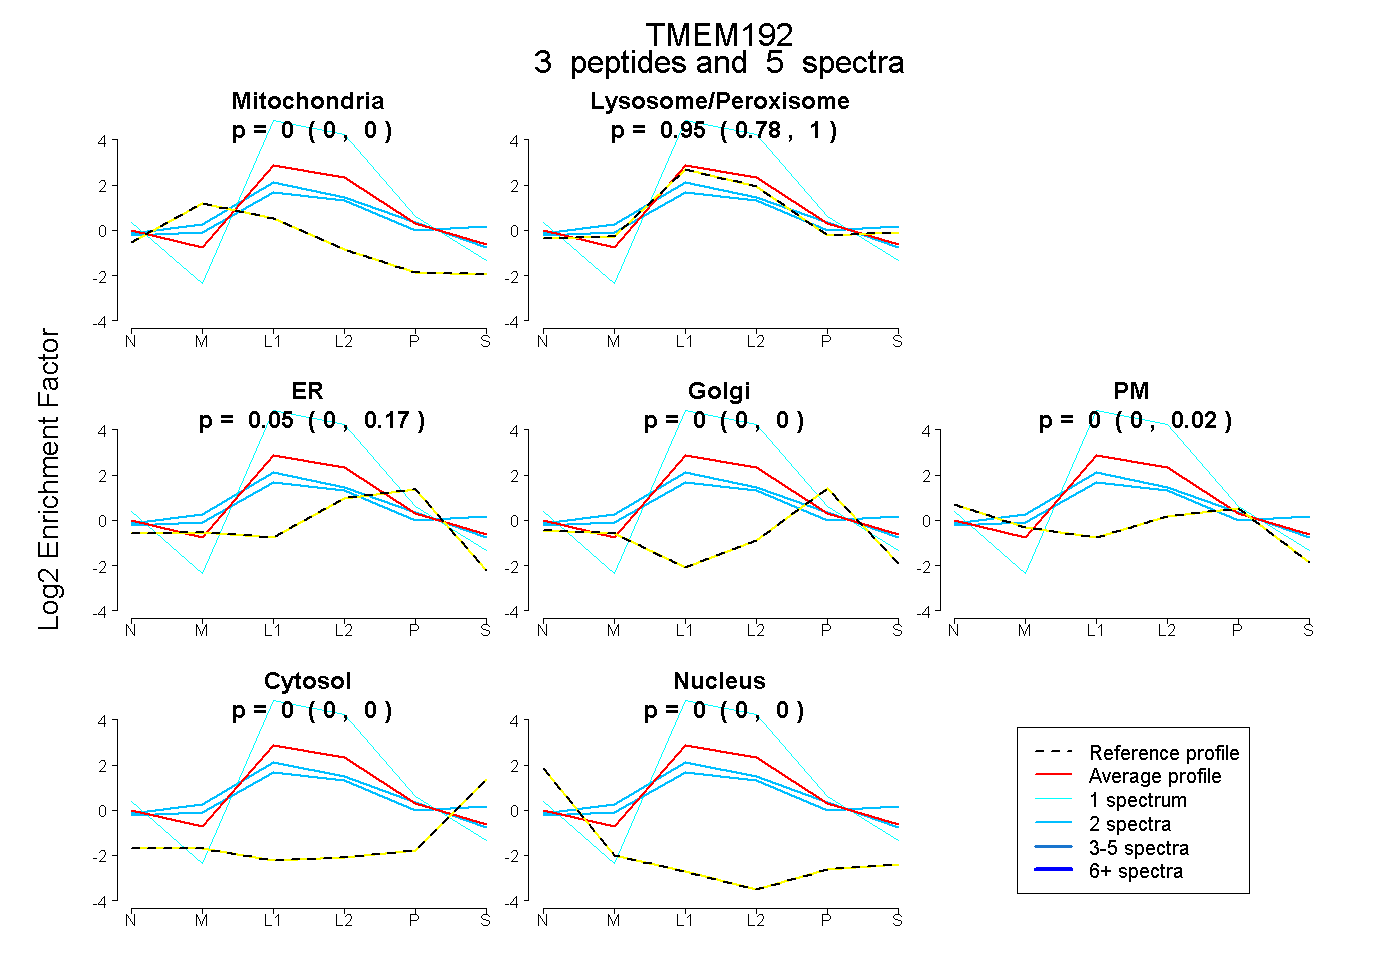
0.000 | 0.000
0.779 | 1.000
0.000 | 0.174
0.000 | 0.000
0.000 | 0.018
0.000 | 0.000
0.000 | 0.000
8peptides
spectra
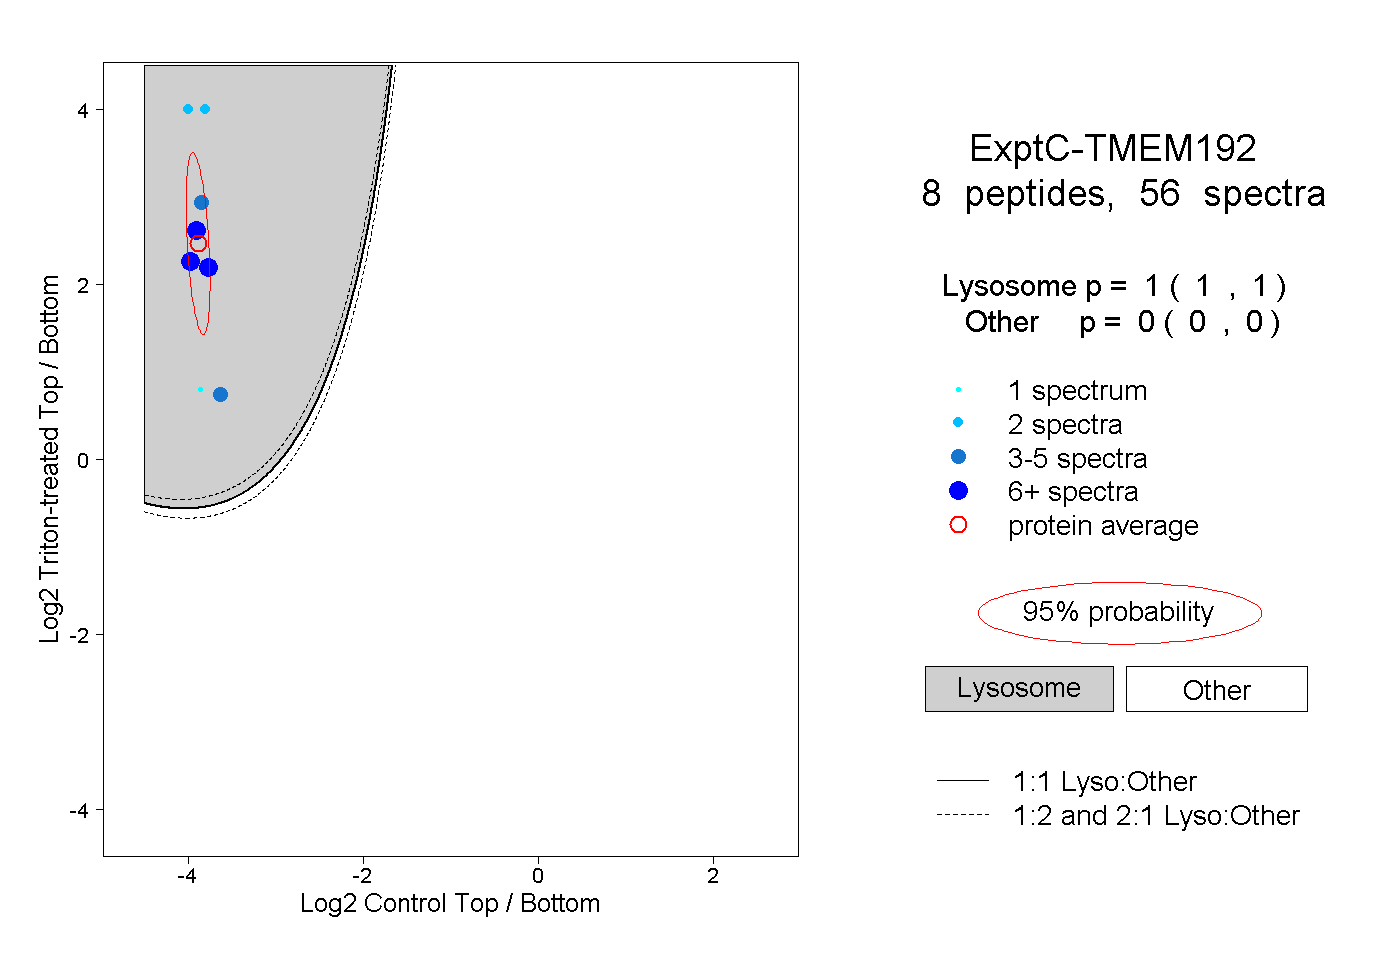
1.000 | 1.000
0.000 | 0.000
4peptides
spectra
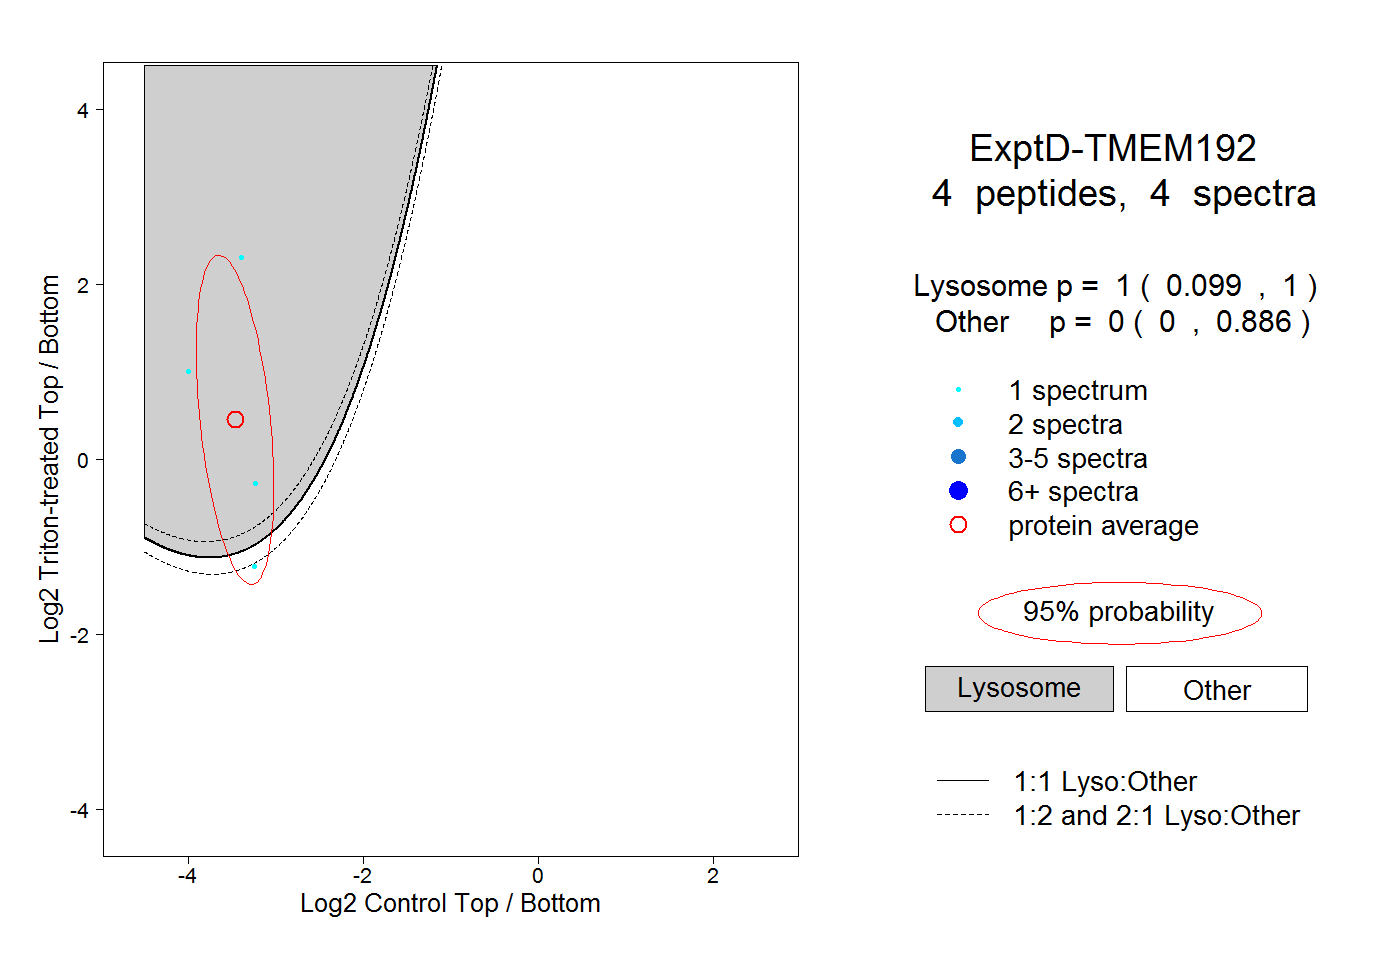
0.099 | 1.000
0.000 | 0.886