 6
6peptides
spectra
0.000 | 0.000
0.844 | 0.952
0.000 | 0.000
0.000 | 0.000
0.000 | 0.000
0.033 | 0.147
0.000 | 0.000
0.000 | 0.000
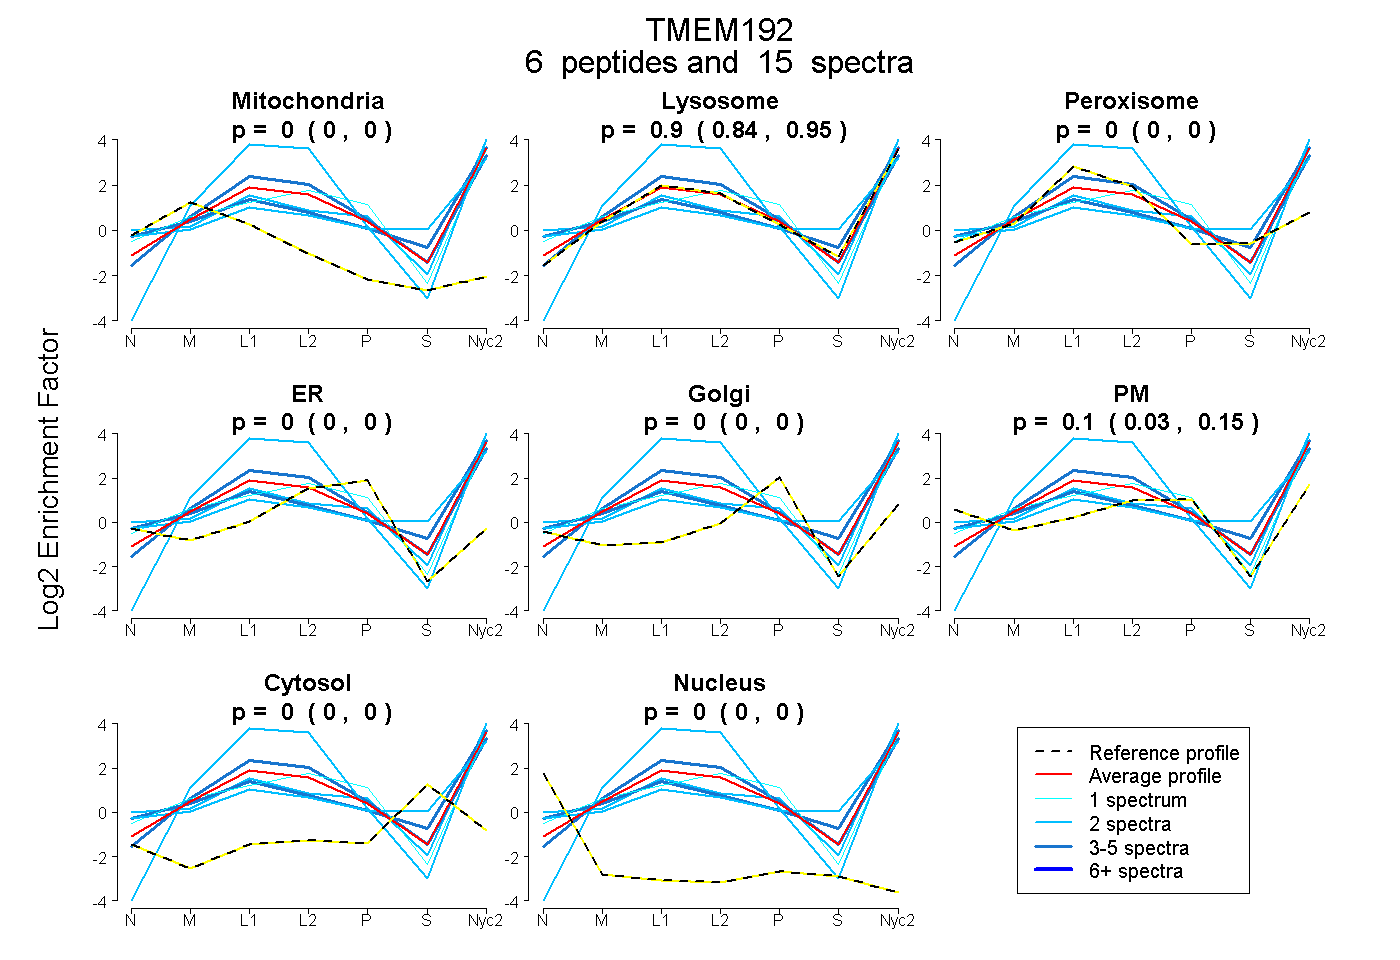
| Plot | Mito | Lyso | Perox | ER | Golgi | PM | Cytosol | Nucleus | |||||
| Expt A |
6 peptides |
15 spectra |
|
0.000 0.000 | 0.000 |
0.902 0.844 | 0.952 |
0.000 0.000 | 0.000 |
0.000 0.000 | 0.000 |
0.000 0.000 | 0.000 |
0.098 0.033 | 0.147 |
0.000 0.000 | 0.000 |
0.000 0.000 | 0.000 |
| 3 spectra, CYAYPSNIASETGFR | 0.000 | 0.932 | 0.064 | 0.003 | 0.000 | 0.000 | 0.000 | 0.000 | ||
| 2 spectra, CPENYTNPLK | 0.000 | 0.637 | 0.000 | 0.000 | 0.000 | 0.363 | 0.000 | 0.000 | ||
| 1 spectrum, HNALLSK | 0.000 | 0.614 | 0.000 | 0.000 | 0.000 | 0.386 | 0.000 | 0.000 | ||
| 2 spectra, QGDIIVYLK | 0.000 | 0.699 | 0.000 | 0.000 | 0.000 | 0.118 | 0.183 | 0.000 | ||
| 5 spectra, GYSQIYR | 0.000 | 0.780 | 0.000 | 0.000 | 0.000 | 0.171 | 0.037 | 0.012 | ||
| 2 spectra, LLELATQPAR | 0.000 | 1.000 | 0.000 | 0.000 | 0.000 | 0.000 | 0.000 | 0.000 |
| Plot | Mito | Lyso or Perox | ER | Golgi | PM | Cytosol | Nucleus | ||||||
| Expt B |
3 peptides |
5 spectra |
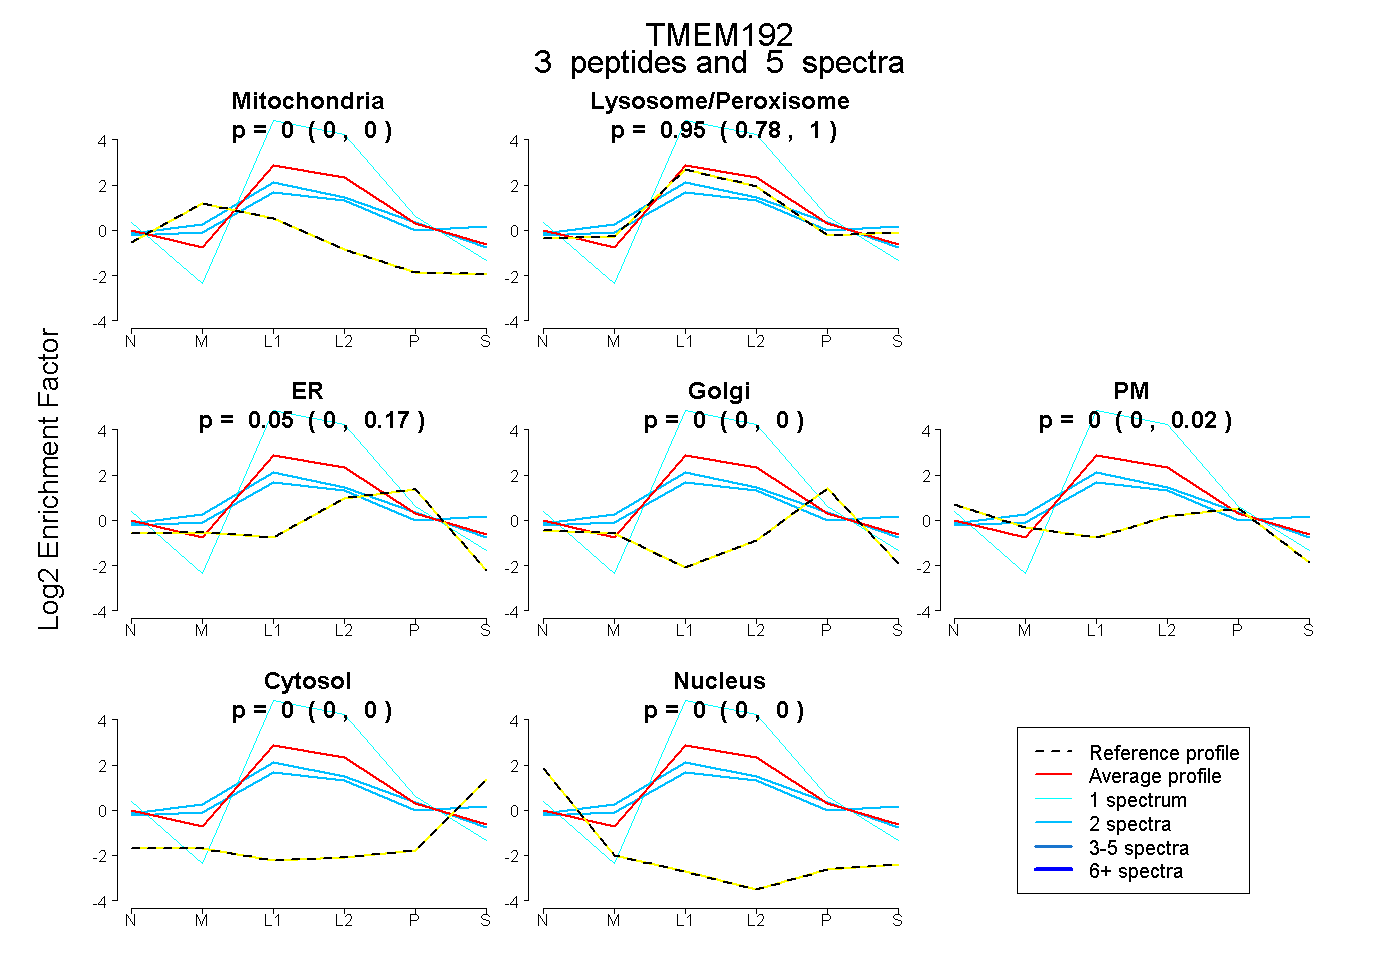 |
0.000 0.000 | 0.000 |
0.946 0.779 | 1.000 |
0.054 0.000 | 0.174 |
0.000 0.000 | 0.000 |
0.000 0.000 | 0.018 |
0.000 0.000 | 0.000 |
0.000 0.000 | 0.000 |
|||
| Plot | Lyso | Other | |||||||||||
| Expt C |
8 peptides |
56 spectra |
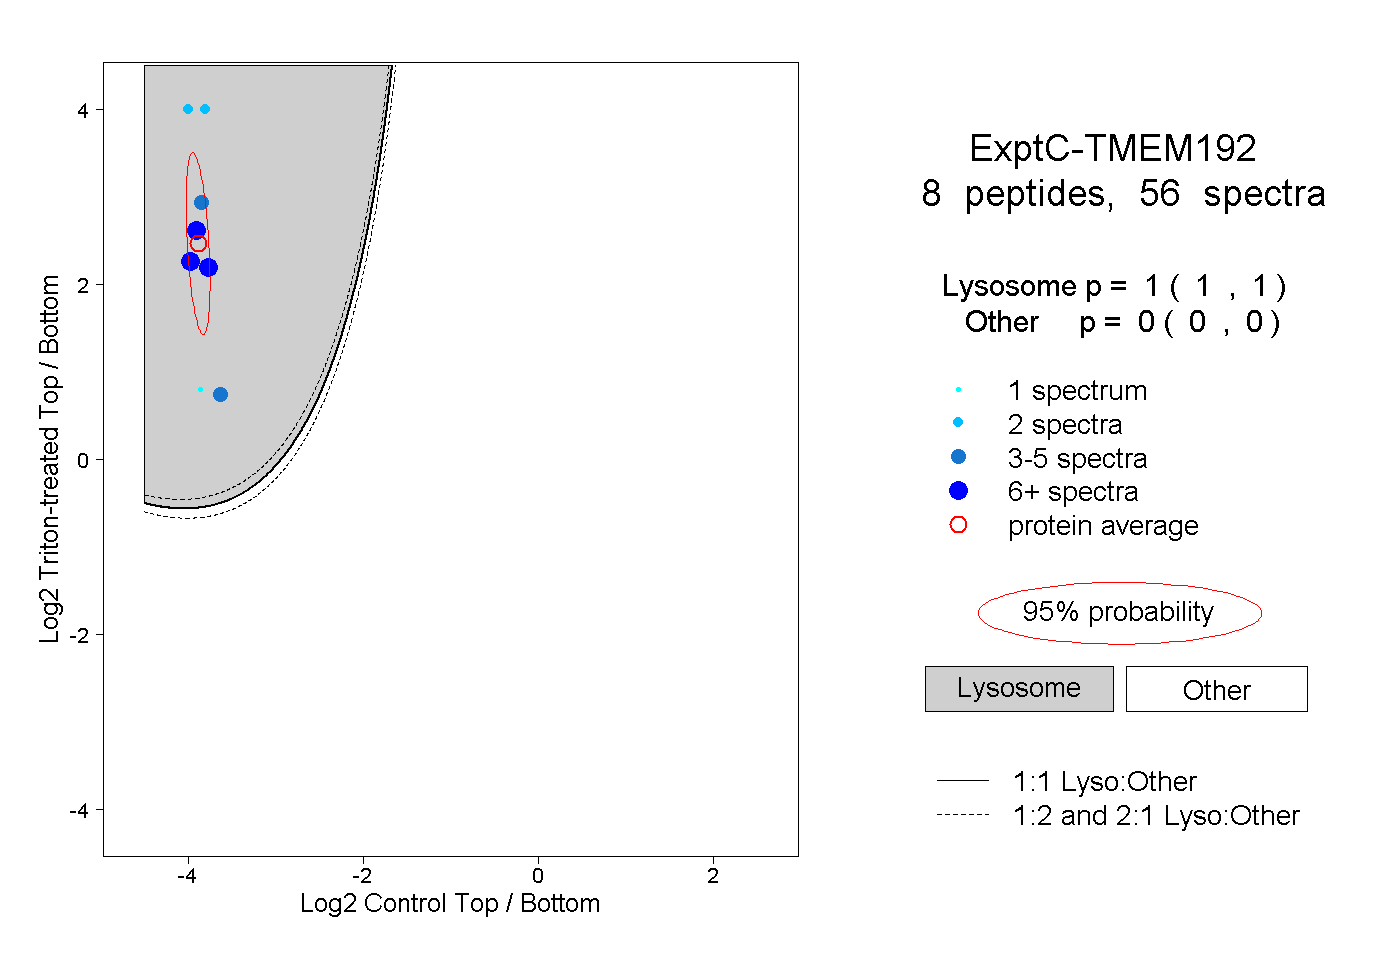 |
1.000 1.000 | 1.000 |
0.000 0.000 | 0.000 |
||||||||
| Plot | Lyso | Other | |||||||||||
| Expt D |
4 peptides |
4 spectra |
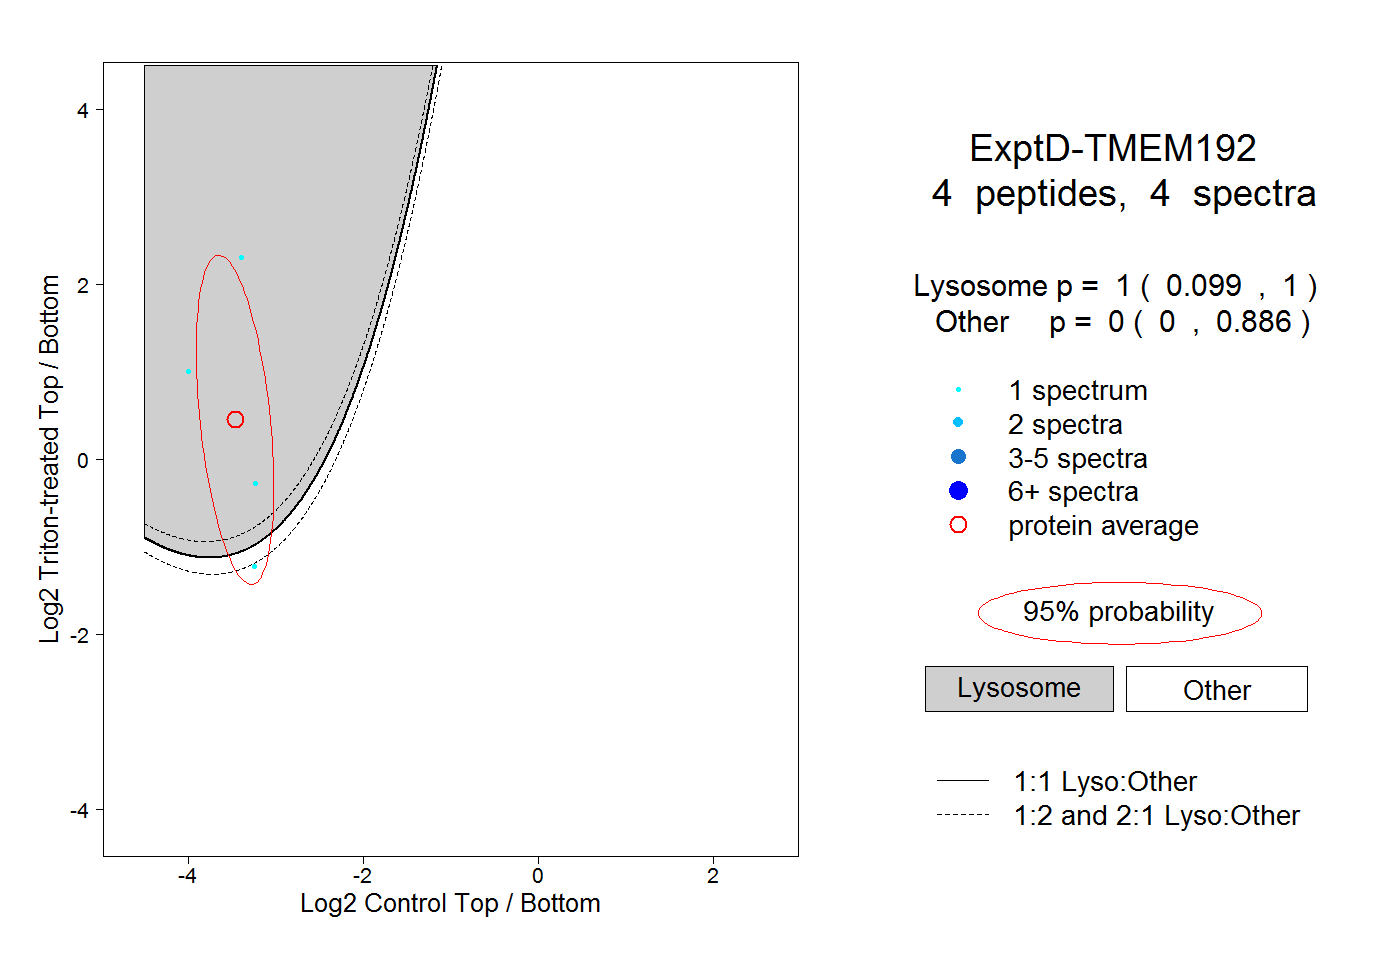 |
1.000 0.099 | 1.000 |
0.000 0.000 | 0.886 |