 5
5peptides
spectra
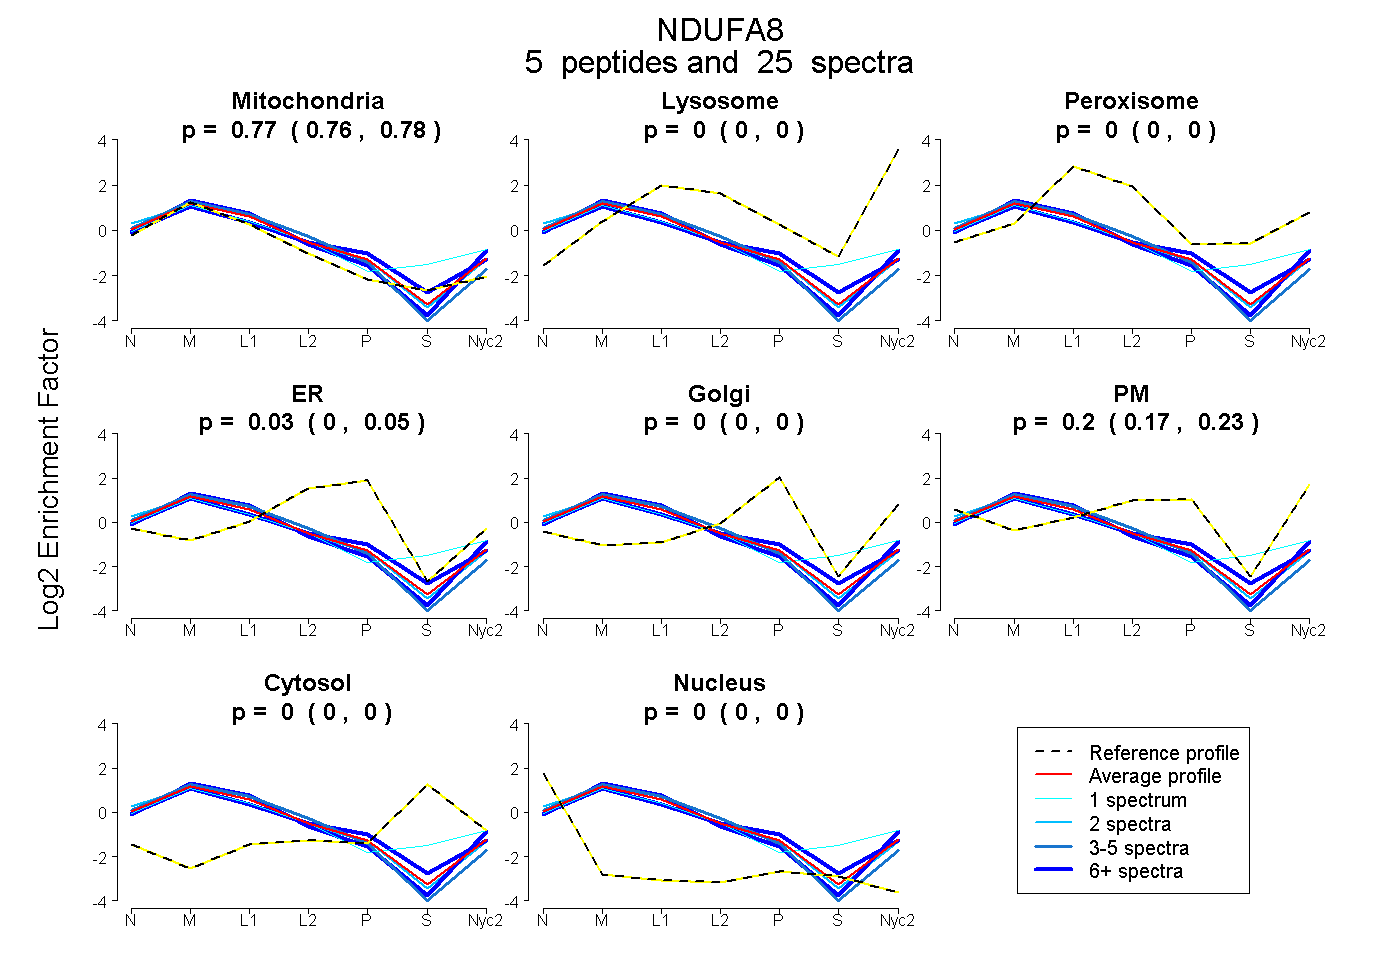
0.761 | 0.782
0.000 | 0.000
0.000 | 0.000
0.000 | 0.051
0.000 | 0.000
0.168 | 0.227
0.000 | 0.000
0.000 | 0.000
4peptides
spectra
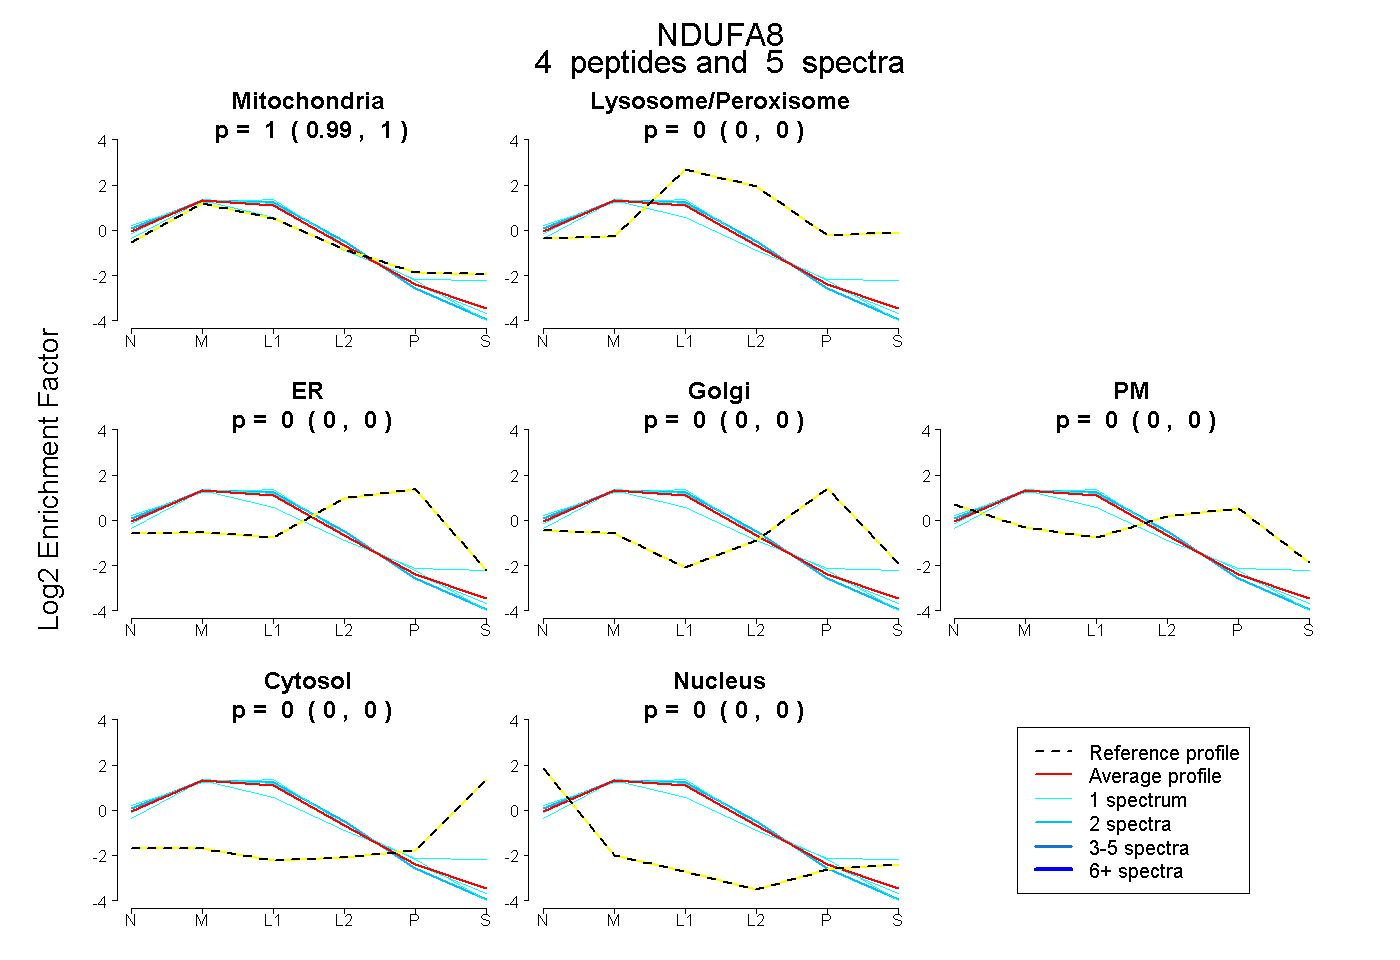
0.993 | 1.000
0.000 | 0.000
0.000 | 0.000
0.000 | 0.000
0.000 | 0.000
0.000 | 0.000
0.000 | 0.005
8peptides
spectra
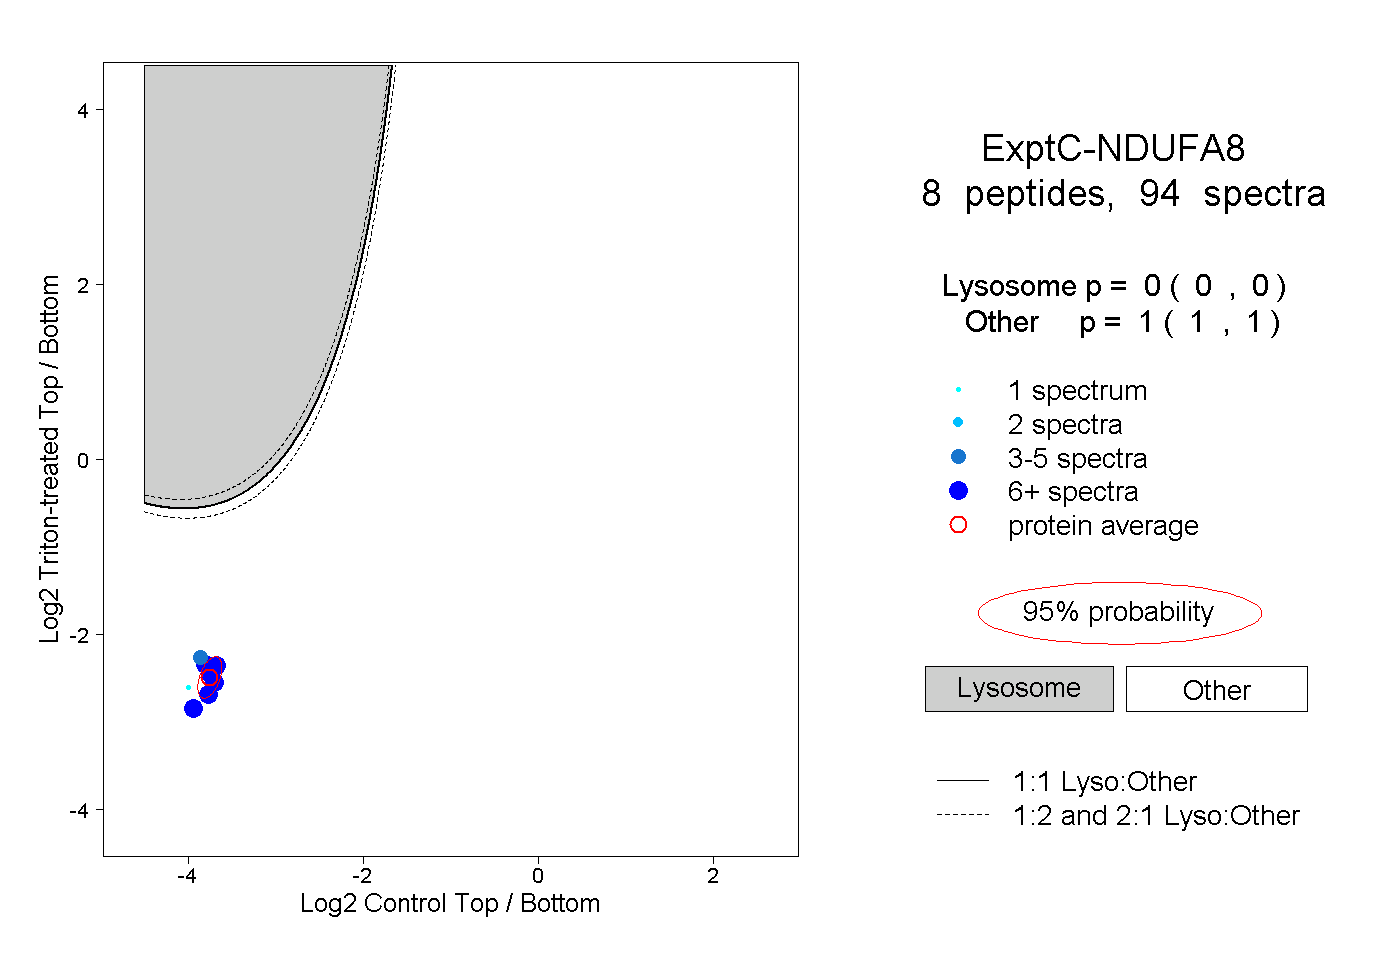
0.000 | 0.000
1.000 | 1.000
4peptides
spectra
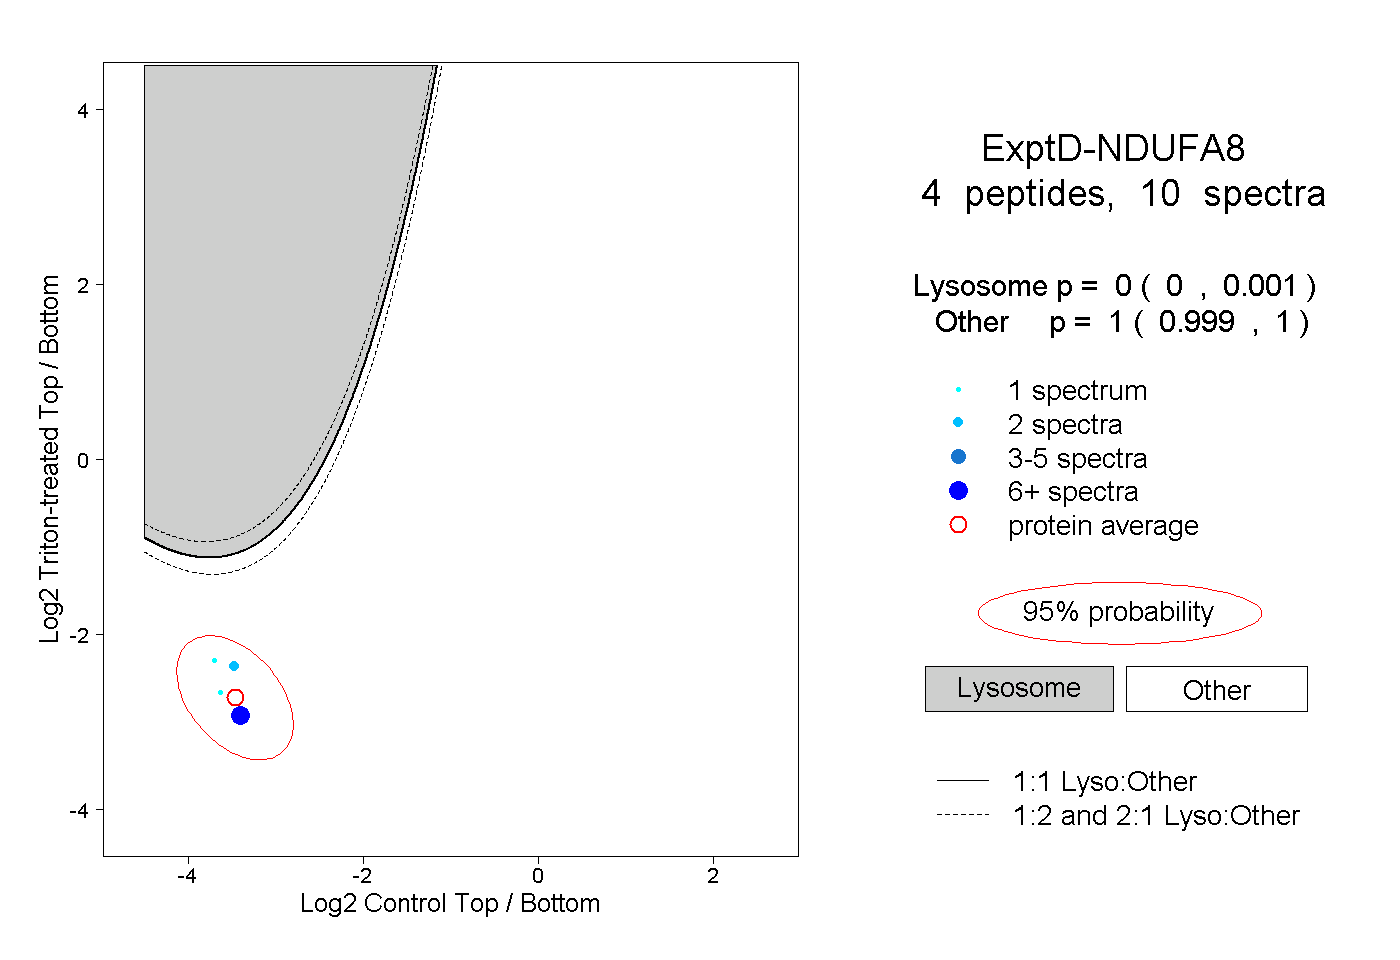
0.000 | 0.001
0.999 | 1.000