 5
5peptides
spectra
0.761 | 0.782
0.000 | 0.000
0.000 | 0.000
0.000 | 0.051
0.000 | 0.000
0.168 | 0.227
0.000 | 0.000
0.000 | 0.000
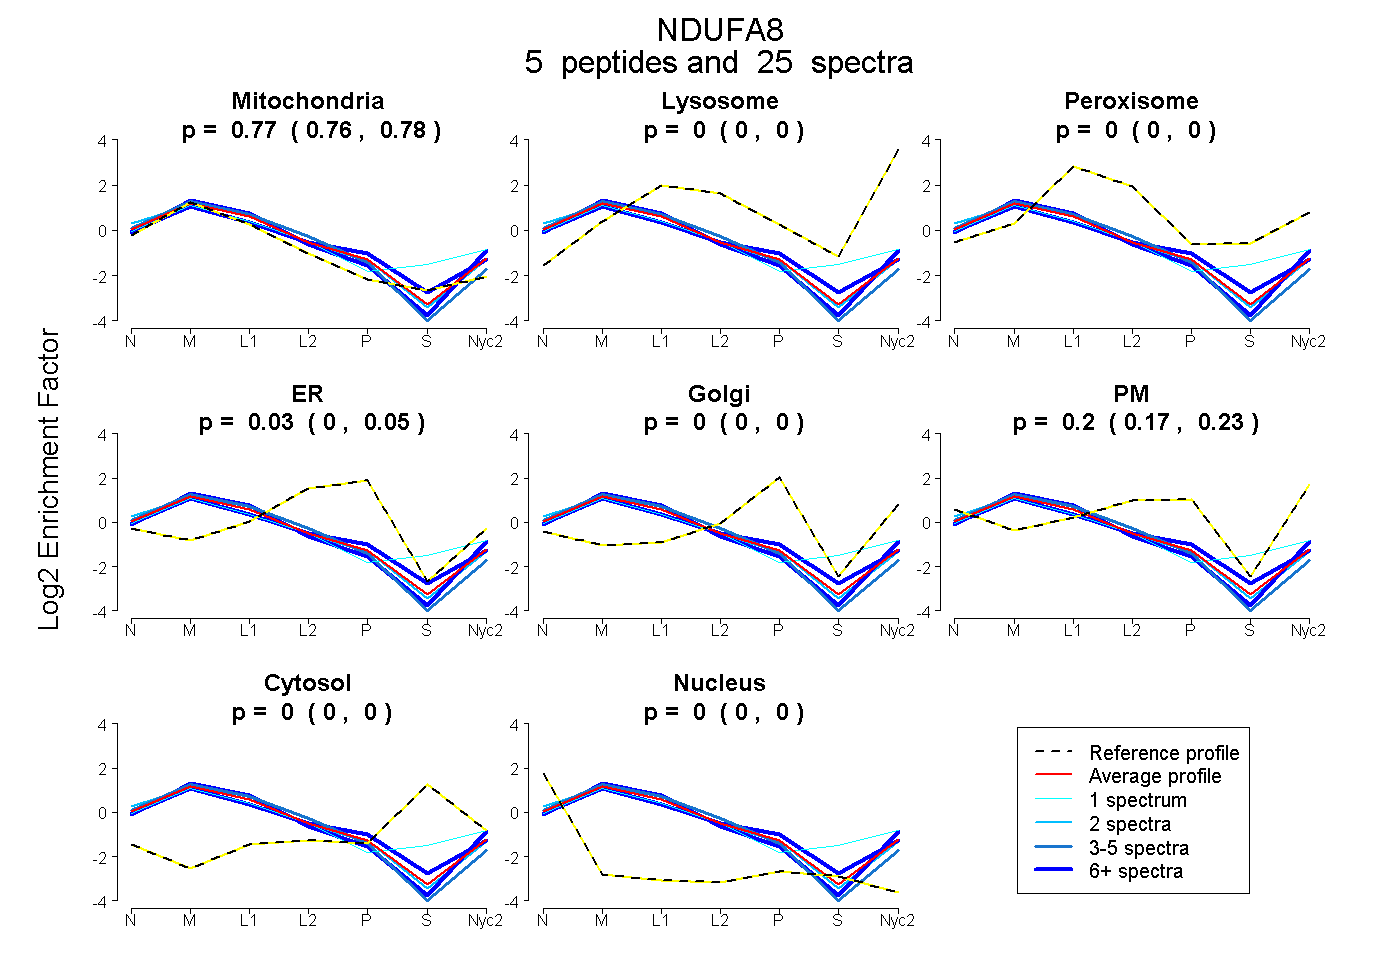
| Plot | Mito | Lyso | Perox | ER | Golgi | PM | Cytosol | Nucleus | |||||
| Expt A |
5 peptides |
25 spectra |
|
0.773 0.761 | 0.782 |
0.000 0.000 | 0.000 |
0.000 0.000 | 0.000 |
0.029 0.000 | 0.051 |
0.000 0.000 | 0.000 |
0.199 0.168 | 0.227 |
0.000 0.000 | 0.000 |
0.000 0.000 | 0.000 |
| 1 spectrum, VSSAVLK | 0.685 | 0.085 | 0.126 | 0.000 | 0.000 | 0.011 | 0.093 | 0.000 | ||
| 4 spectra, LGWVRPDLGELSK | 0.822 | 0.000 | 0.000 | 0.172 | 0.000 | 0.006 | 0.000 | 0.000 | ||
| 12 spectra, FDECVLDK | 0.735 | 0.000 | 0.000 | 0.111 | 0.000 | 0.154 | 0.000 | 0.000 | ||
| 6 spectra, EFMLCR | 0.783 | 0.028 | 0.000 | 0.000 | 0.000 | 0.189 | 0.000 | 0.000 | ||
| 2 spectra, AAAHHYGAQCDK | 0.785 | 0.000 | 0.000 | 0.000 | 0.000 | 0.215 | 0.000 | 0.000 |
| Plot | Mito | Lyso or Perox | ER | Golgi | PM | Cytosol | Nucleus | ||||||
| Expt B |
4 peptides |
5 spectra |
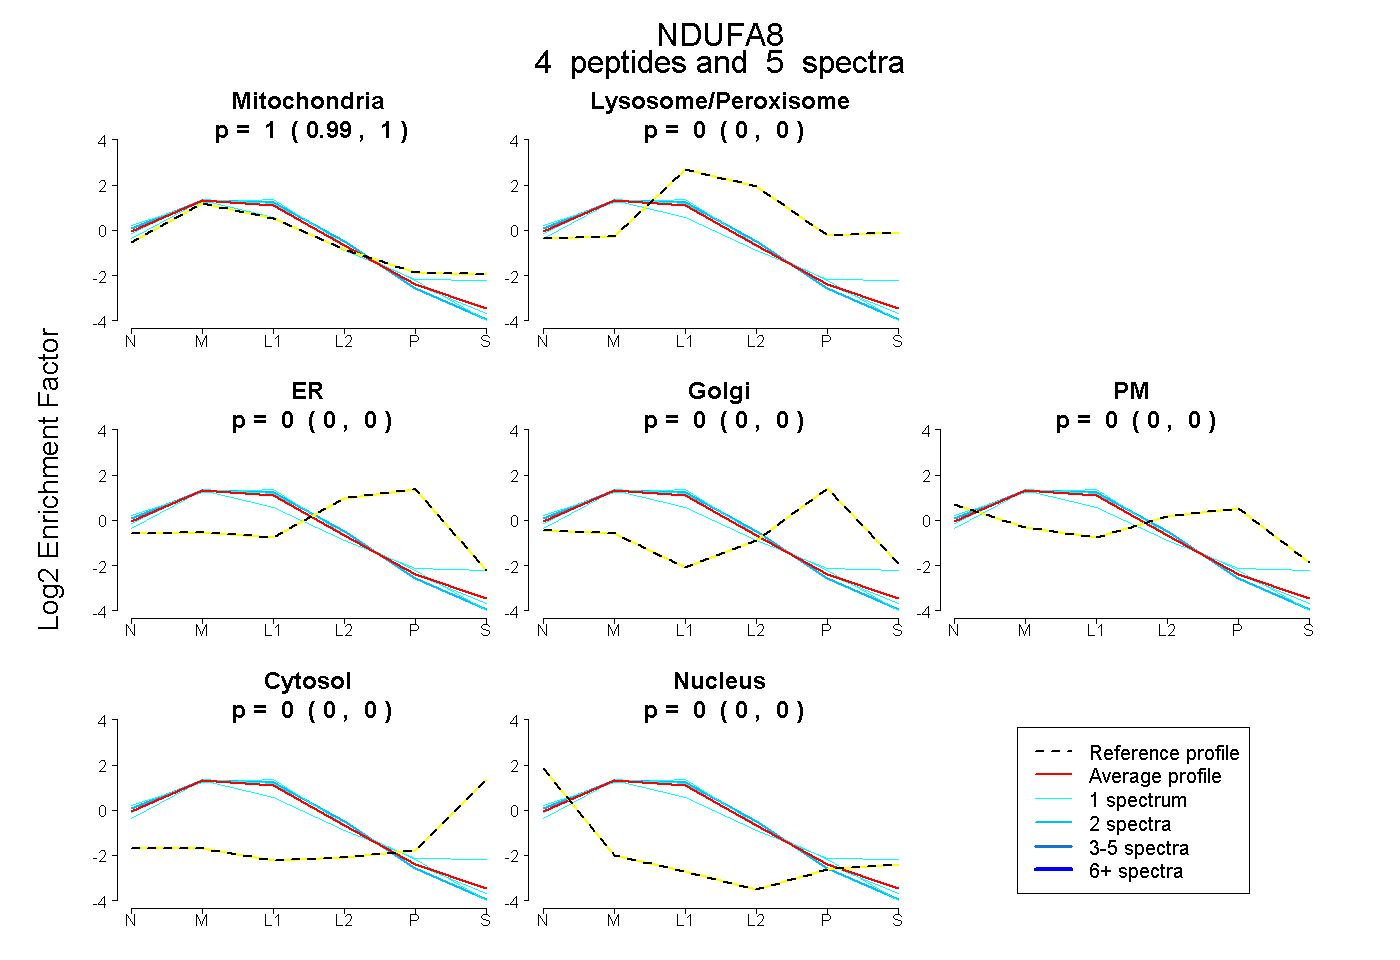 |
1.000 0.993 | 1.000 |
0.000 0.000 | 0.000 |
0.000 0.000 | 0.000 |
0.000 0.000 | 0.000 |
0.000 0.000 | 0.000 |
0.000 0.000 | 0.000 |
0.000 0.000 | 0.005 |
|||
| Plot | Lyso | Other | |||||||||||
| Expt C |
8 peptides |
94 spectra |
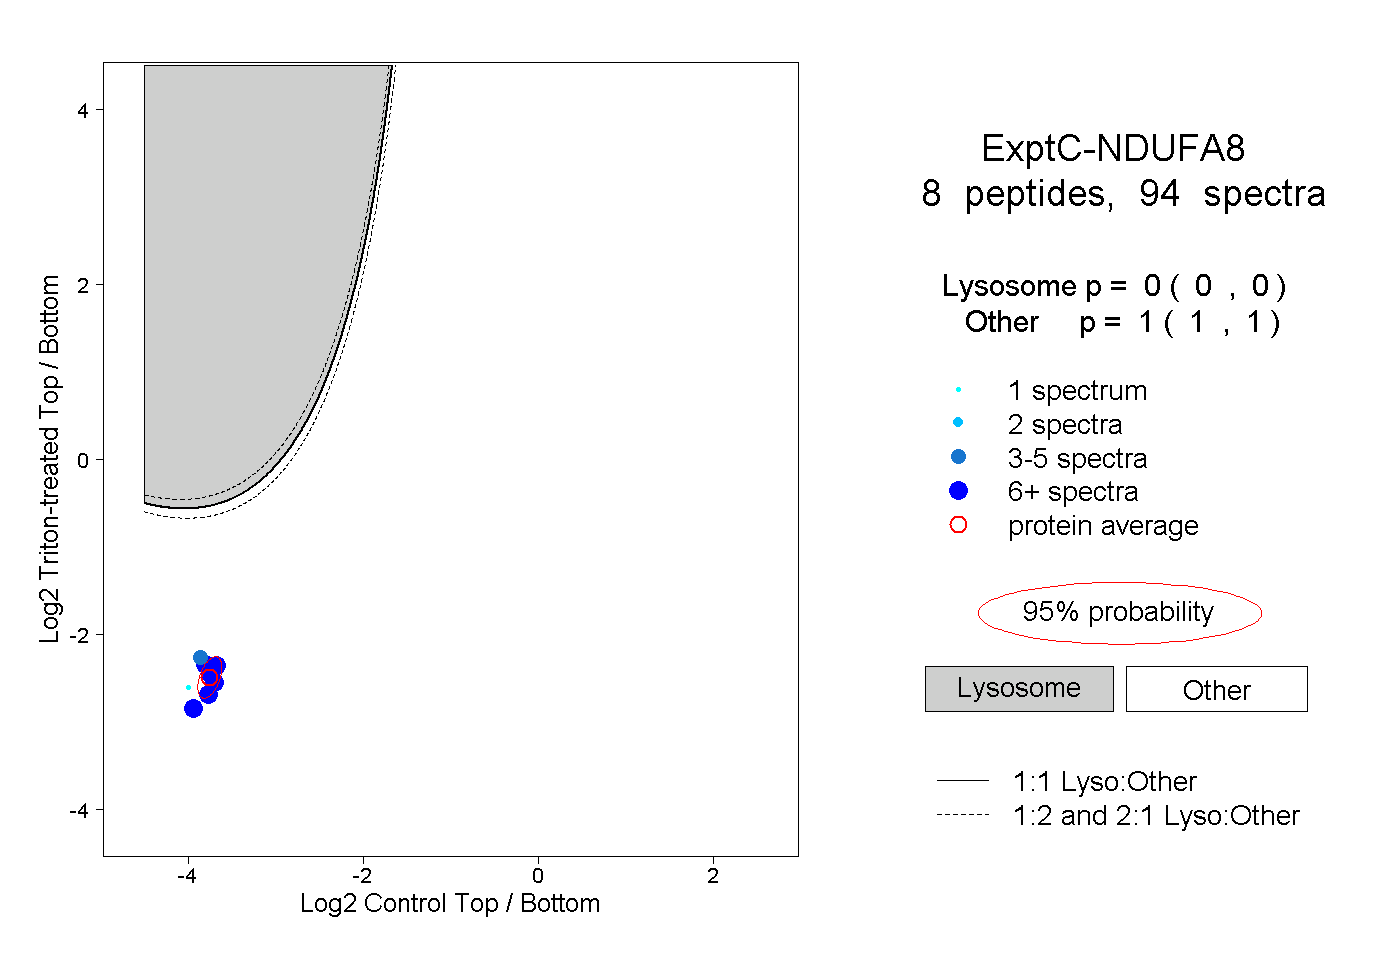 |
0.000 0.000 | 0.000 |
1.000 1.000 | 1.000 |
||||||||
| Plot | Lyso | Other | |||||||||||
| Expt D |
4 peptides |
10 spectra |
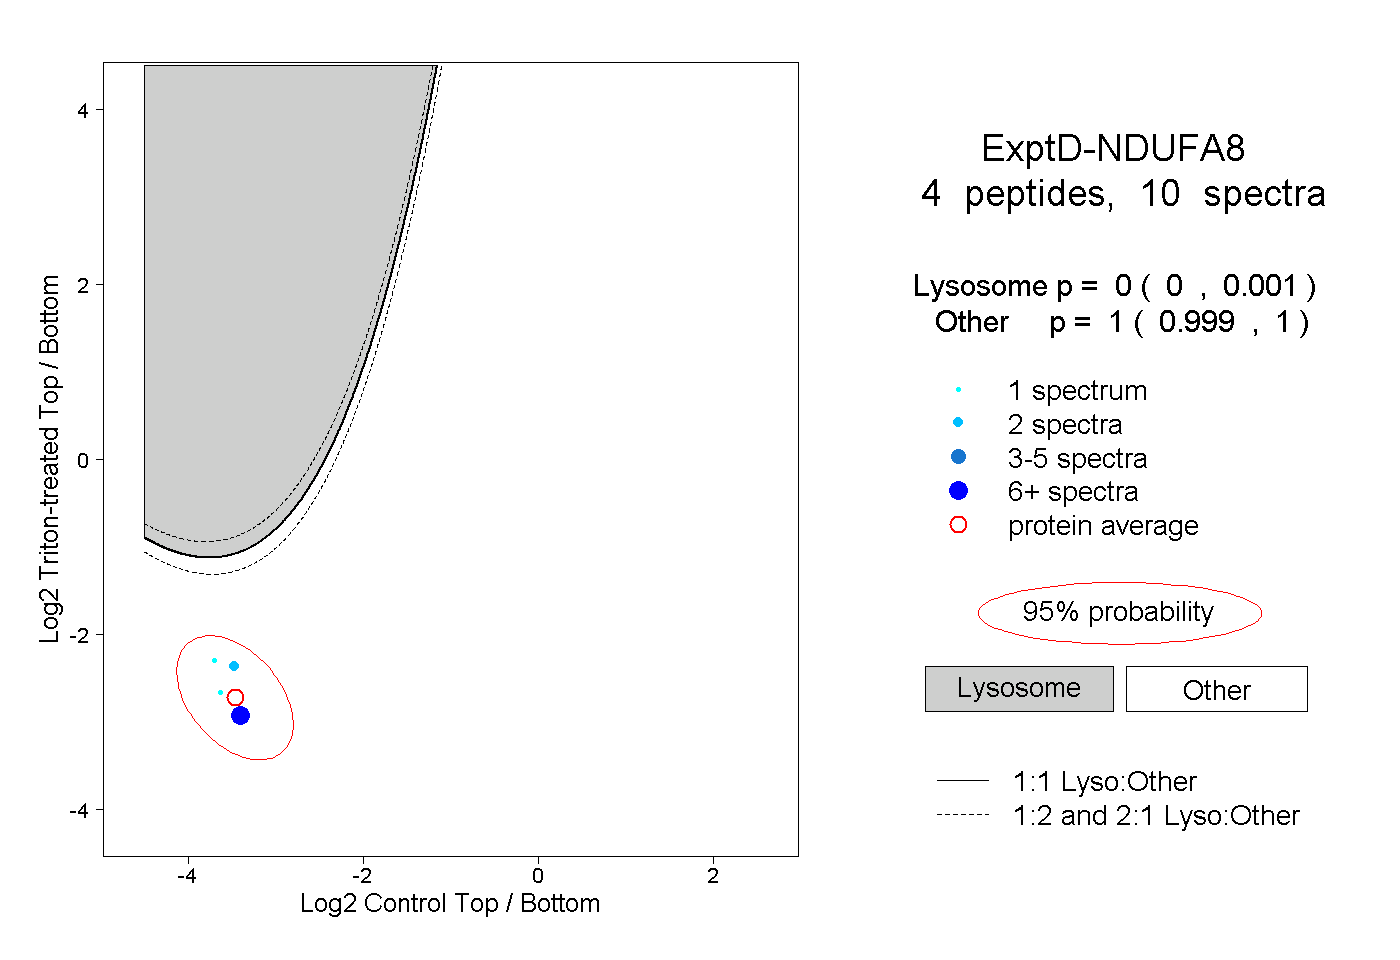 |
0.000 0.000 | 0.001 |
1.000 0.999 | 1.000 |