 4
4peptides
spectra
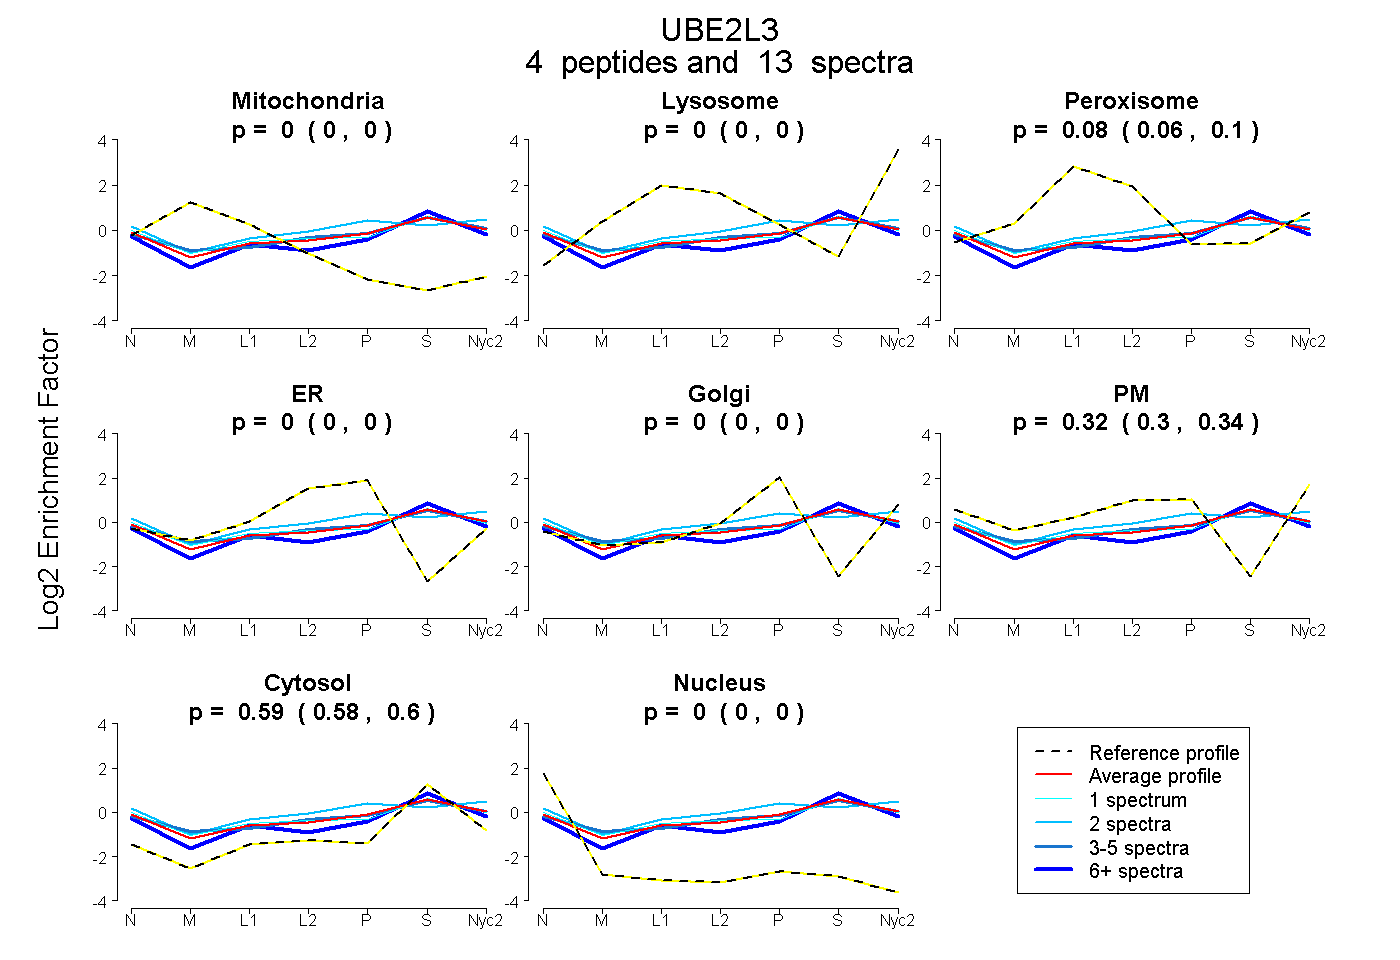
0.000 | 0.000
0.000 | 0.000
0.065 | 0.100
0.000 | 0.000
0.000 | 0.000
0.304 | 0.339
0.579 | 0.604
0.000 | 0.000
2peptides
spectra
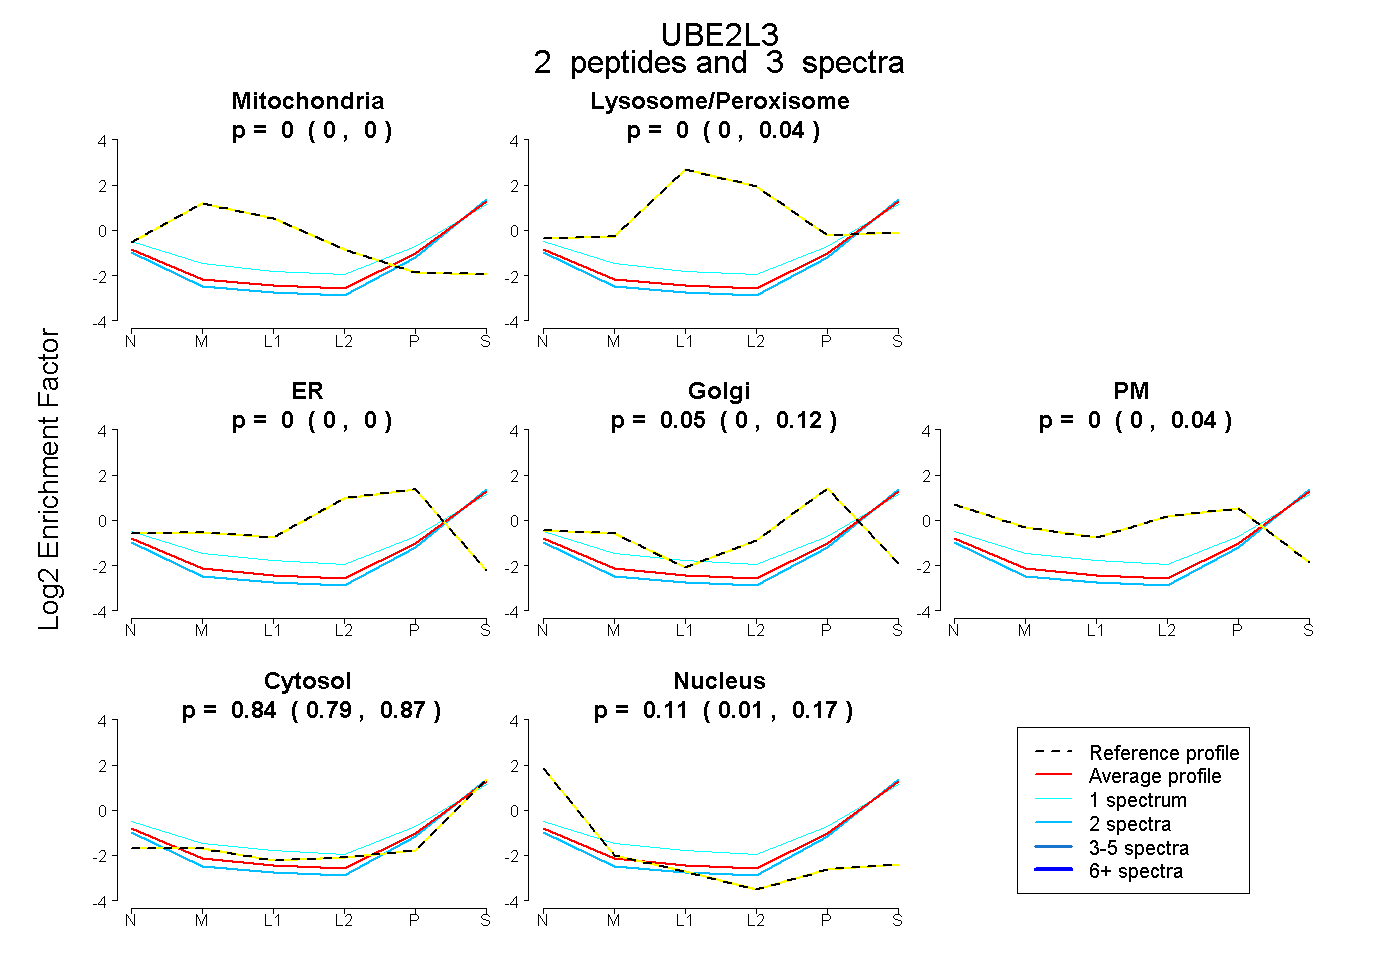
0.000 | 0.000
0.000 | 0.038
0.000 | 0.000
0.000 | 0.124
0.000 | 0.037
0.786 | 0.872
0.013 | 0.169
5peptides
spectra
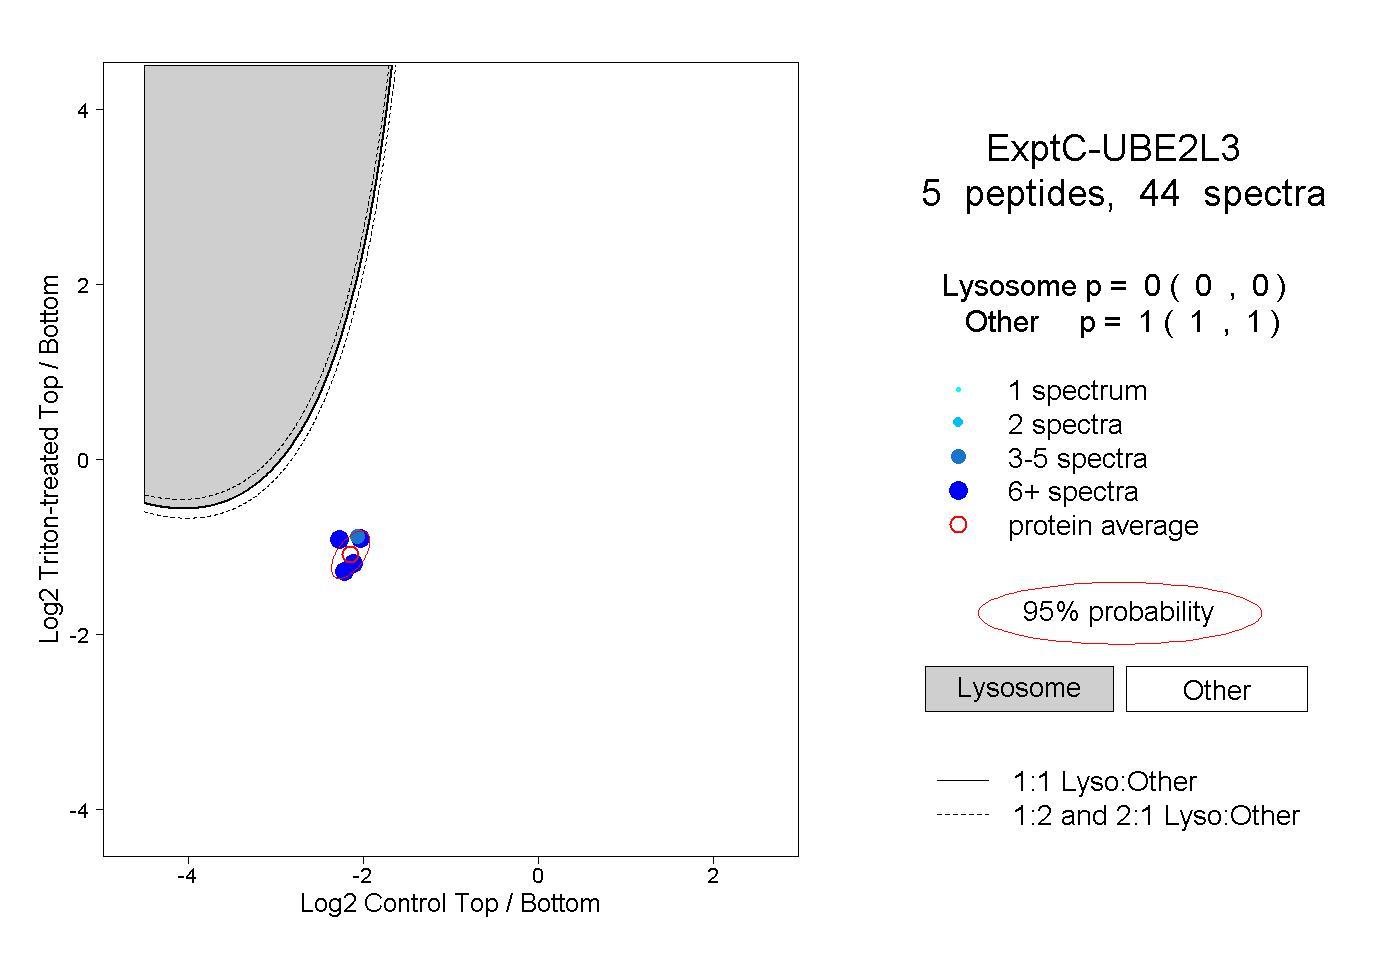
0.000 | 0.000
1.000 | 1.000
2peptides
spectra
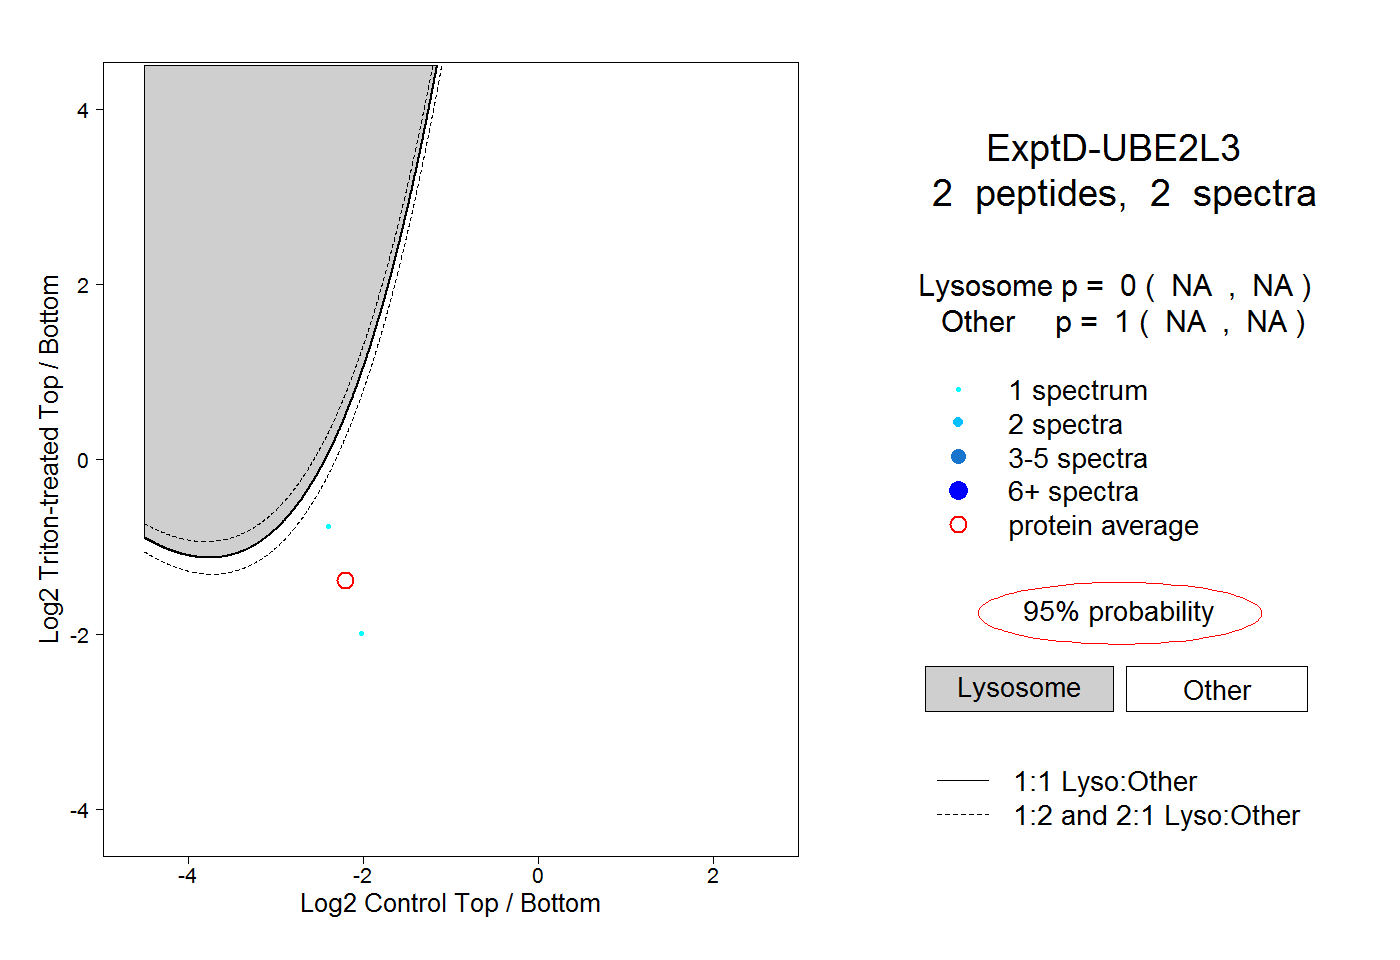
NA | NA
NA | NA