 4
4peptides
spectra
0.000 | 0.000
0.000 | 0.000
0.065 | 0.100
0.000 | 0.000
0.000 | 0.000
0.304 | 0.339
0.579 | 0.604
0.000 | 0.000
| Plot | Mito | Lyso | Perox | ER | Golgi | PM | Cytosol | Nucleus | |||||
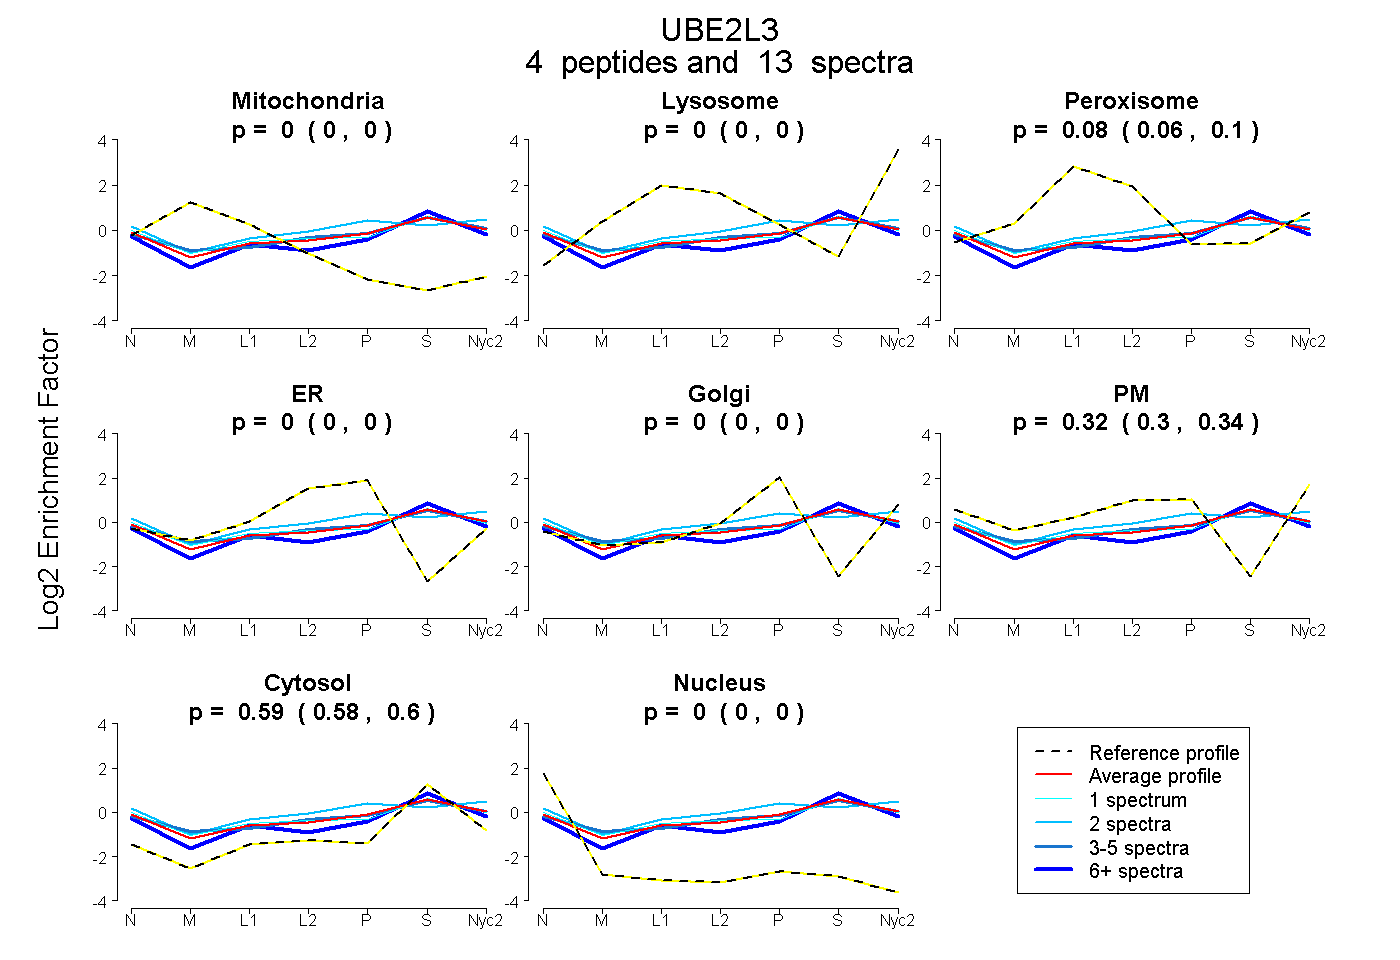
| Expt A |
4 peptides |
13 spectra |
|
0.000 0.000 | 0.000 |
0.000 0.000 | 0.000 |
0.084 0.065 | 0.100 |
0.000 0.000 | 0.000 |
0.000 0.000 | 0.000 |
0.323 0.304 | 0.339 |
0.593 0.579 | 0.604 |
0.000 0.000 | 0.000 |
| 1 spectrum, TDQVIQSLIALVNDPQPEHPLR | 0.000 | 0.000 | 0.140 | 0.000 | 0.000 | 0.280 | 0.580 | 0.000 | ||
| 2 spectra, IYHPNIDEK | 0.000 | 0.000 | 0.084 | 0.000 | 0.000 | 0.461 | 0.454 | 0.000 | ||
| 6 spectra, ADLAEEYSK | 0.000 | 0.000 | 0.067 | 0.000 | 0.000 | 0.229 | 0.704 | 0.000 | ||
| 4 spectra, NAEEFTK | 0.000 | 0.000 | 0.090 | 0.000 | 0.000 | 0.332 | 0.578 | 0.000 |
| Plot | Mito | Lyso or Perox | ER | Golgi | PM | Cytosol | Nucleus | ||||||
| Expt B |
2 peptides |
3 spectra |
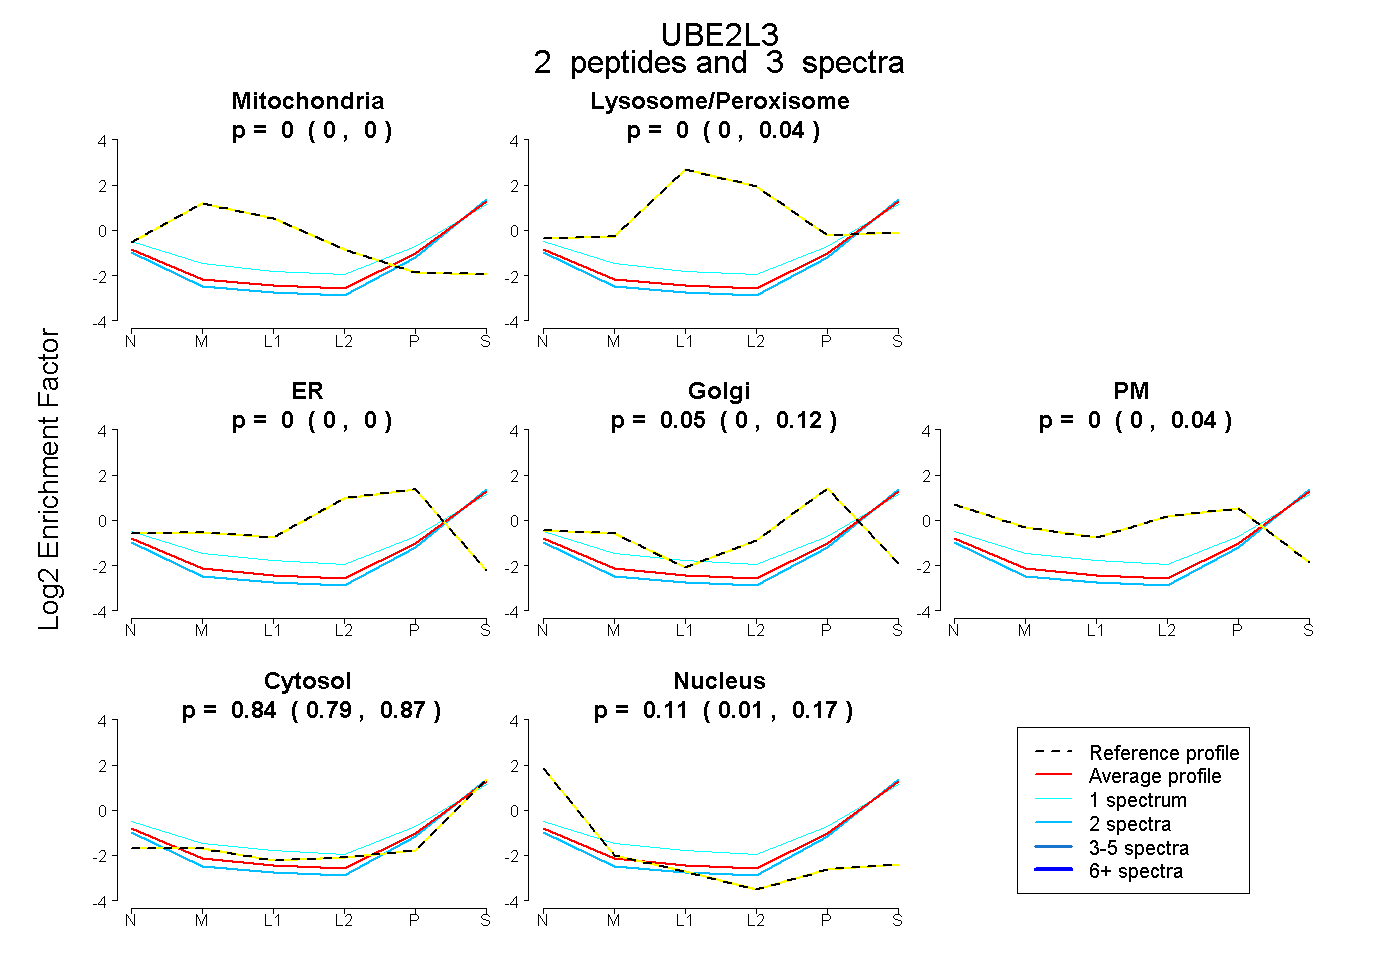 |
0.000 0.000 | 0.000 |
0.000 0.000 | 0.038 |
0.000 0.000 | 0.000 |
0.054 0.000 | 0.124 |
0.000 0.000 | 0.037 |
0.840 0.786 | 0.872 |
0.106 0.013 | 0.169 |
|||
| Plot | Lyso | Other | |||||||||||
| Expt C |
5 peptides |
44 spectra |
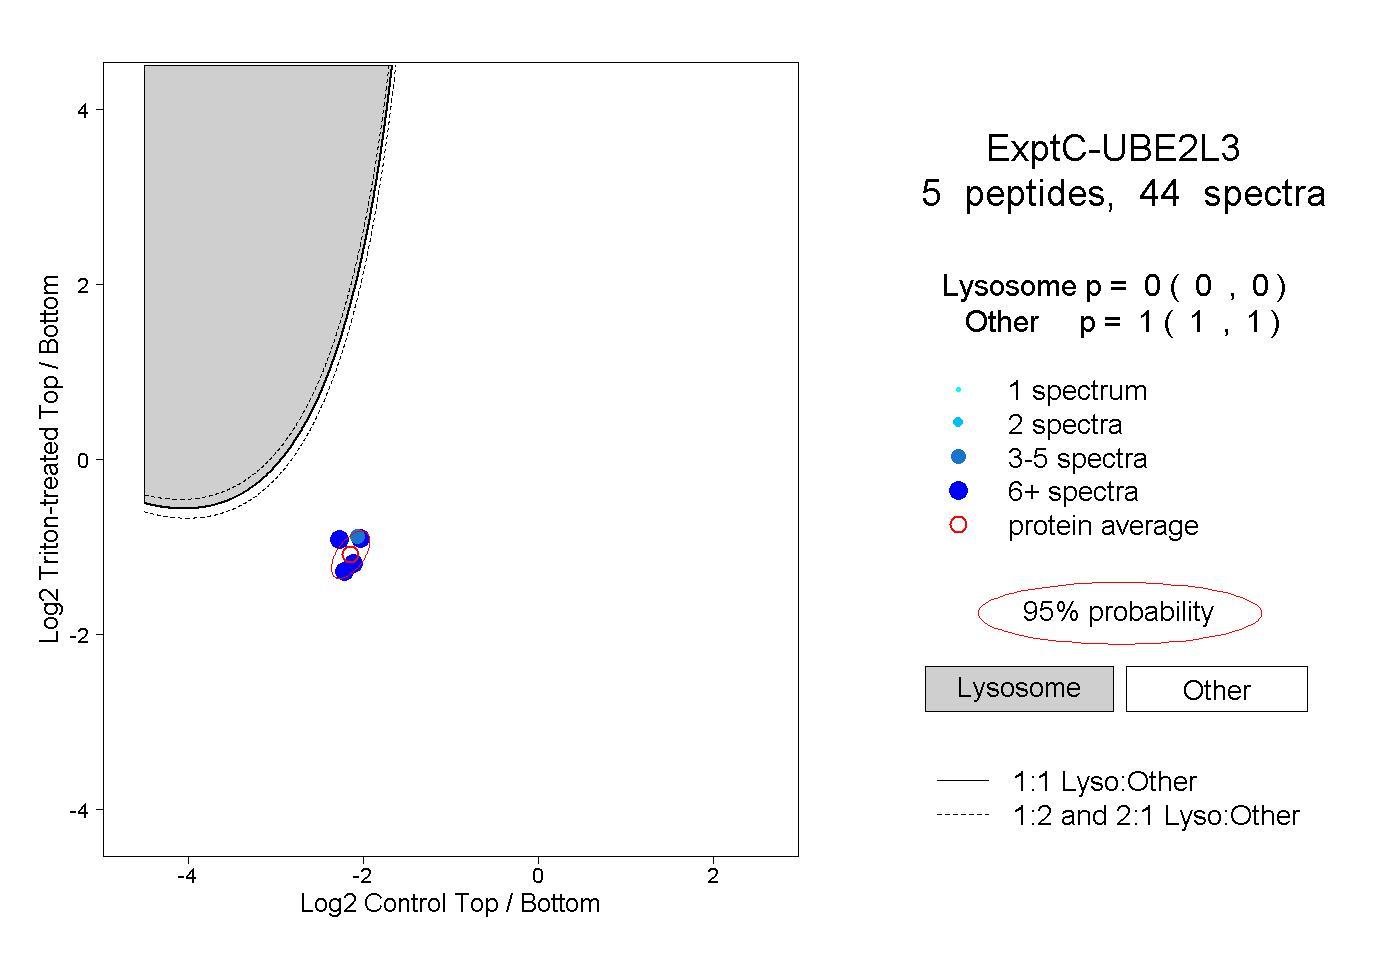 |
0.000 0.000 | 0.000 |
1.000 1.000 | 1.000 |
||||||||
| Plot | Lyso | Other | |||||||||||
| Expt D |
2 peptides |
2 spectra |
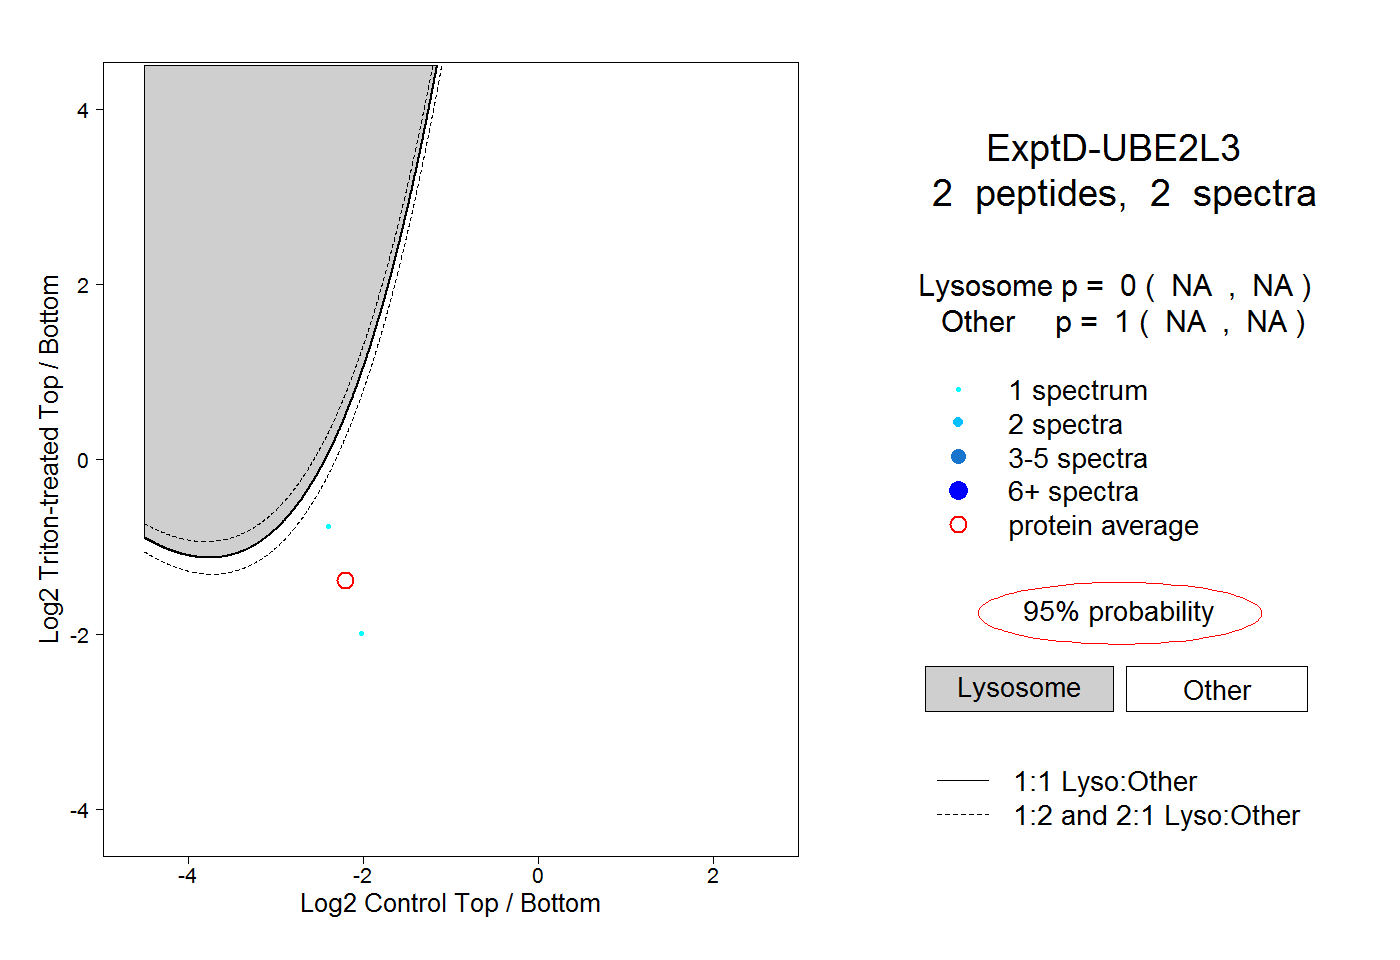 |
0.000 NA | NA |
1.000 NA | NA |