 5
5peptides
spectra
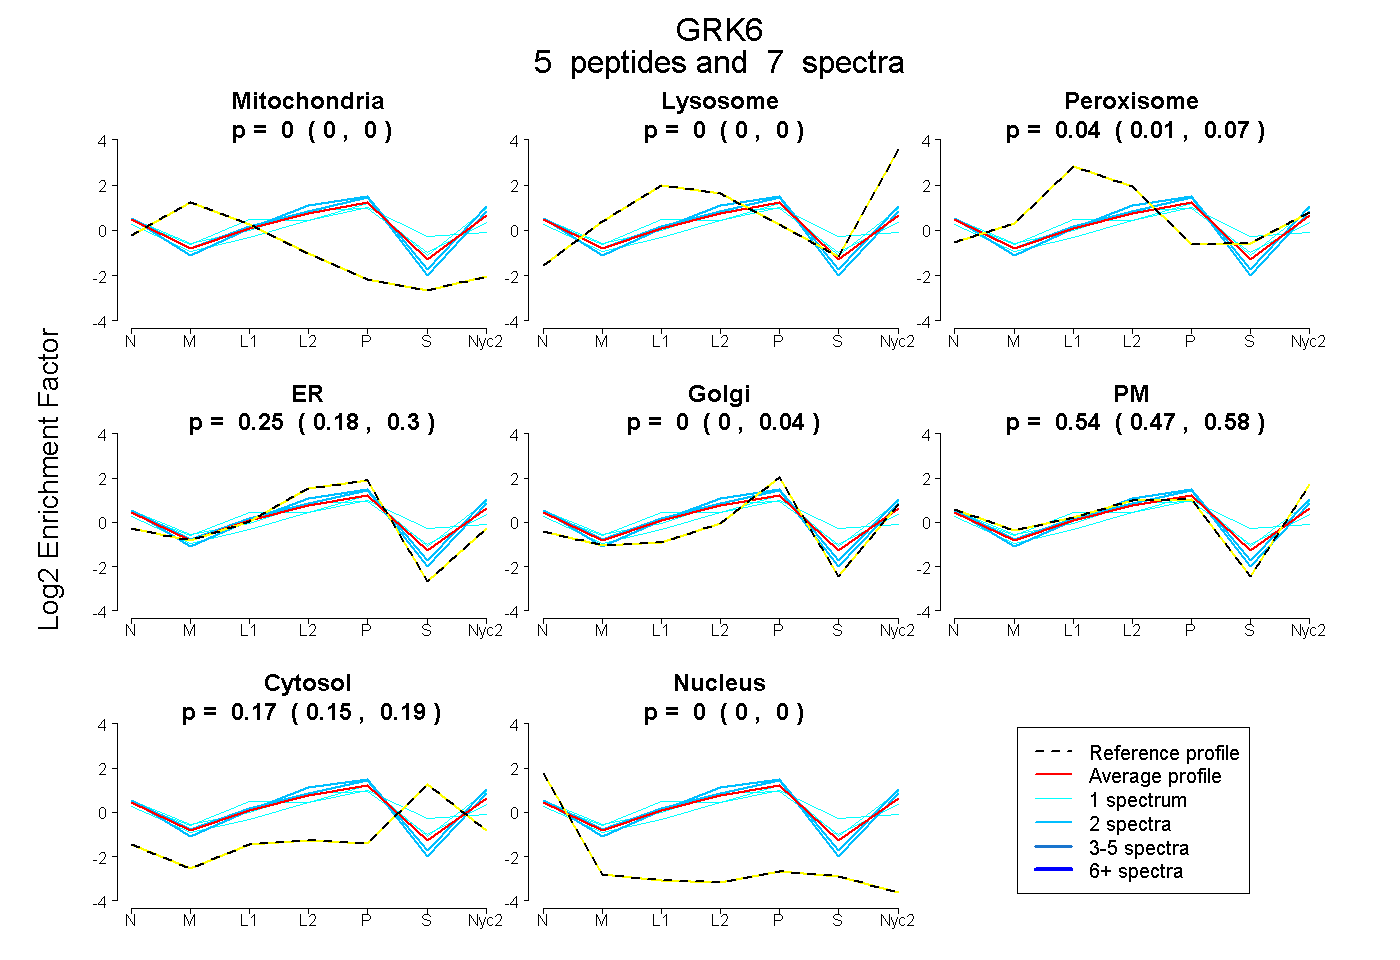
0.000 | 0.000
0.000 | 0.000
0.011 | 0.068
0.182 | 0.300
0.000 | 0.044
0.474 | 0.581
0.148 | 0.190
0.000 | 0.000
3peptides
spectra
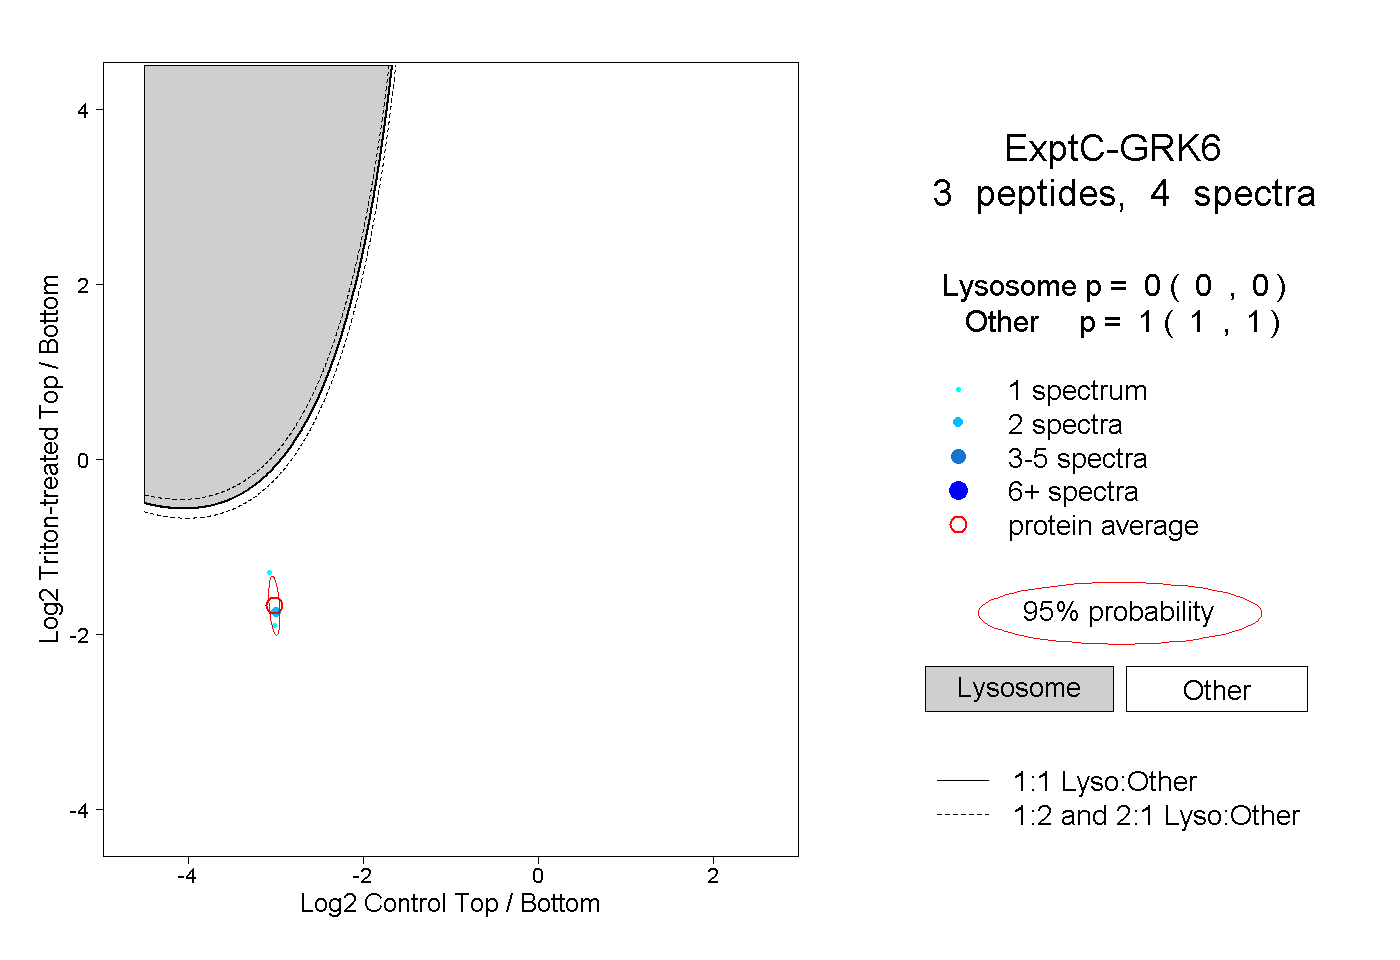
0.000 | 0.000
1.000 | 1.000
1peptide
spectrum
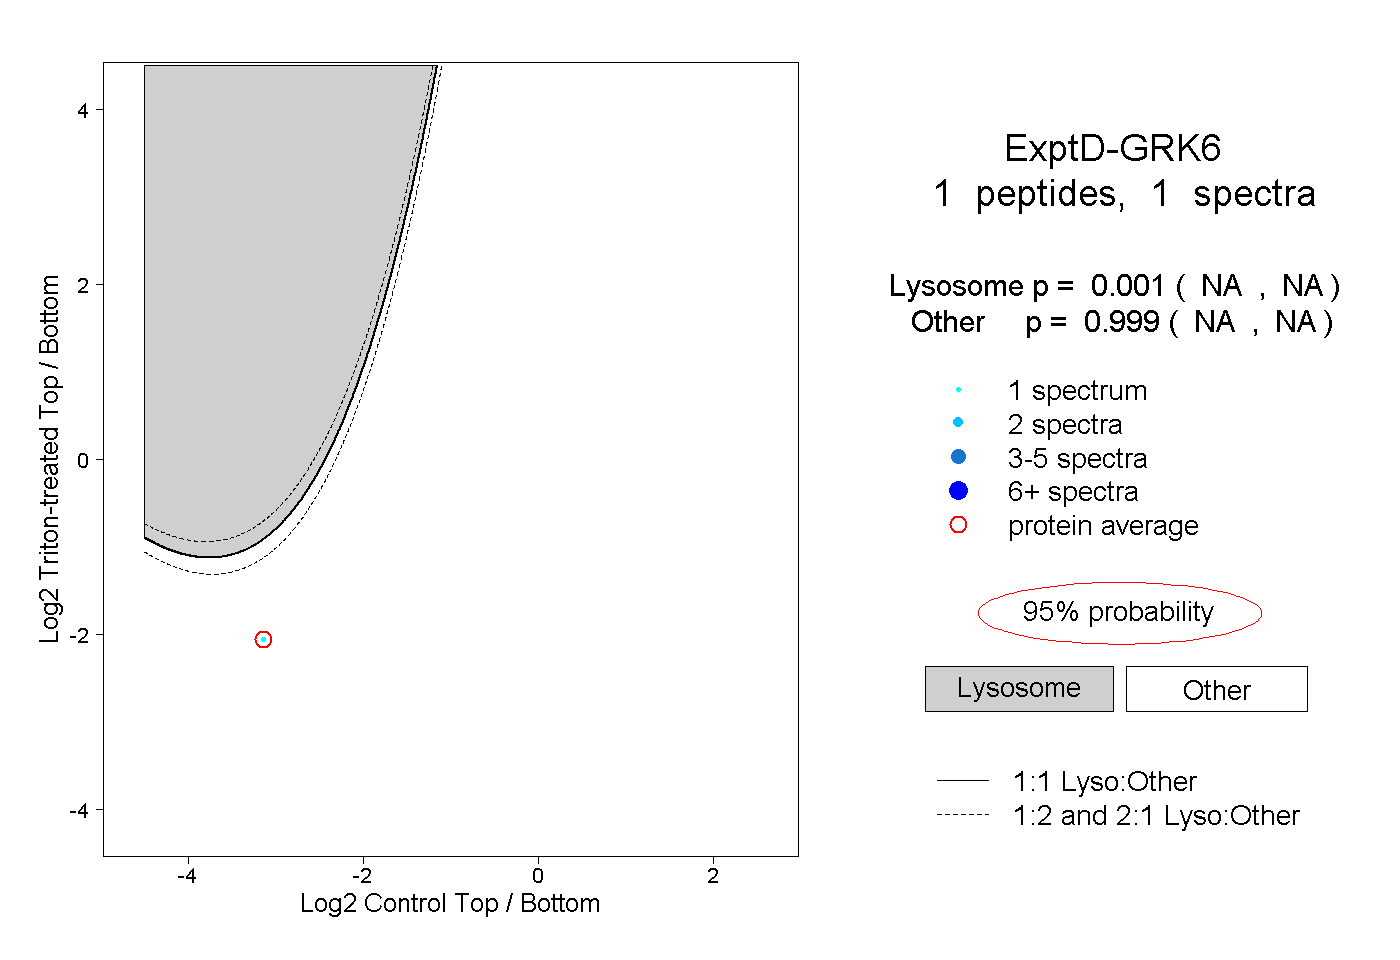
NA | NA
NA | NA