 5
5peptides
spectra
0.000 | 0.000
0.000 | 0.000
0.011 | 0.068
0.182 | 0.300
0.000 | 0.044
0.474 | 0.581
0.148 | 0.190
0.000 | 0.000
| Plot | Mito | Lyso | Perox | ER | Golgi | PM | Cytosol | Nucleus | |||||
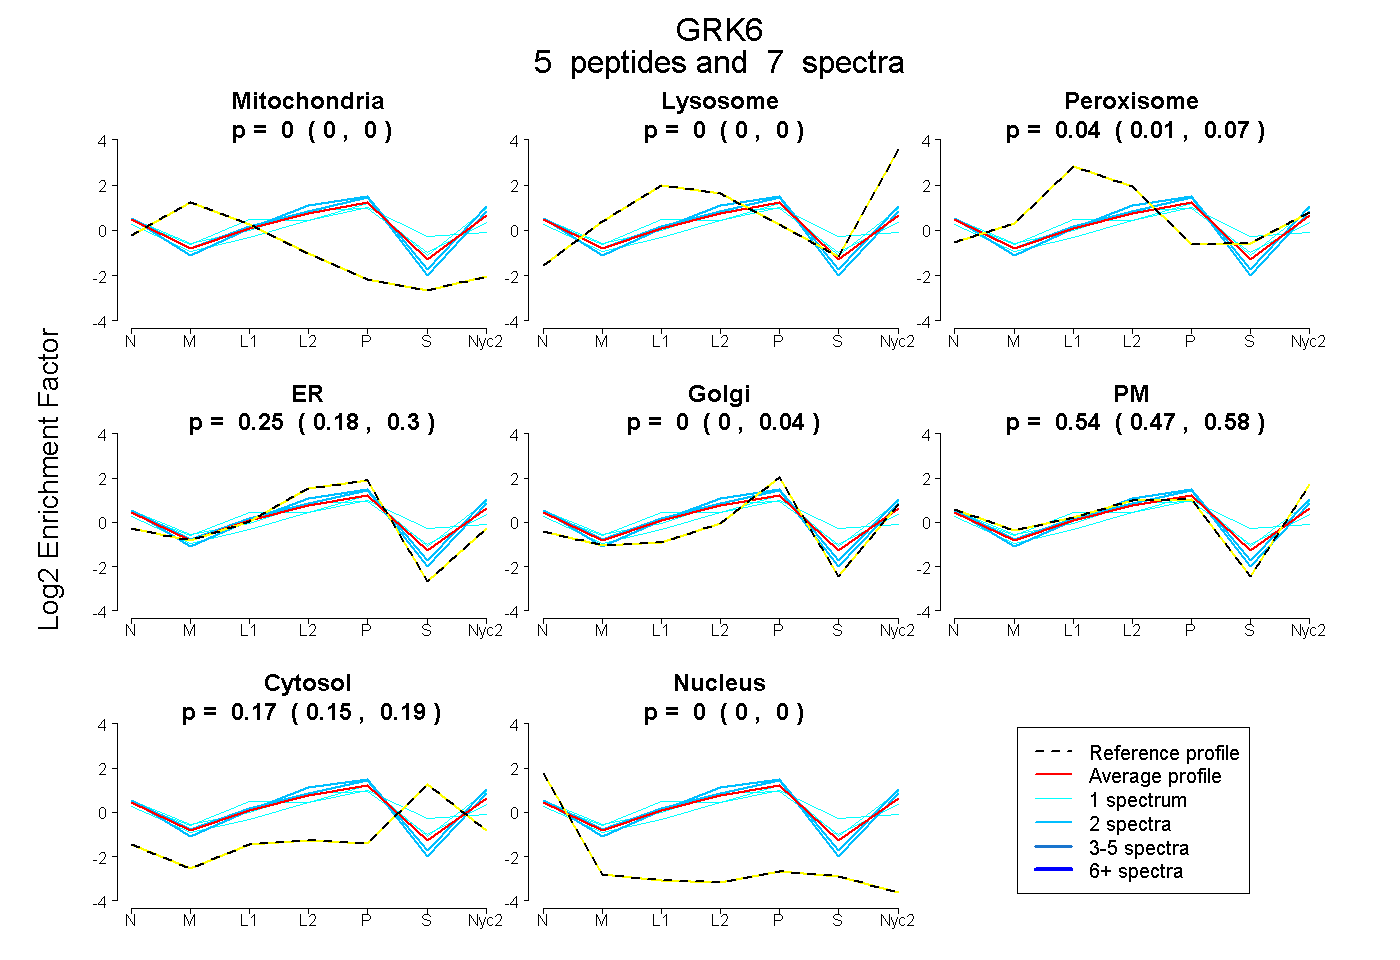
| Expt A |
5 peptides |
7 spectra |
|
0.000 0.000 | 0.000 |
0.000 0.000 | 0.000 |
0.039 0.011 | 0.068 |
0.250 0.182 | 0.300 |
0.000 0.000 | 0.044 |
0.540 0.474 | 0.581 |
0.172 0.148 | 0.190 |
0.000 0.000 | 0.000 |
| 2 spectra, QLVSNCAQR | 0.000 | 0.000 | 0.000 | 0.271 | 0.000 | 0.636 | 0.094 | 0.000 | ||
| 2 spectra, EVAEEYTDR | 0.000 | 0.000 | 0.000 | 0.282 | 0.047 | 0.603 | 0.068 | 0.000 | ||
| 1 spectrum, DYHSLCER | 0.000 | 0.000 | 0.097 | 0.254 | 0.000 | 0.450 | 0.199 | 0.000 | ||
| 1 spectrum, EFCATRPELTR | 0.000 | 0.000 | 0.059 | 0.329 | 0.000 | 0.260 | 0.353 | 0.000 | ||
| 1 spectrum, DVLDIEQFSTVK | 0.000 | 0.000 | 0.203 | 0.000 | 0.263 | 0.425 | 0.109 | 0.000 |
| Plot | Lyso | Other | |||||||||||
| Expt C |
3 peptides |
4 spectra |
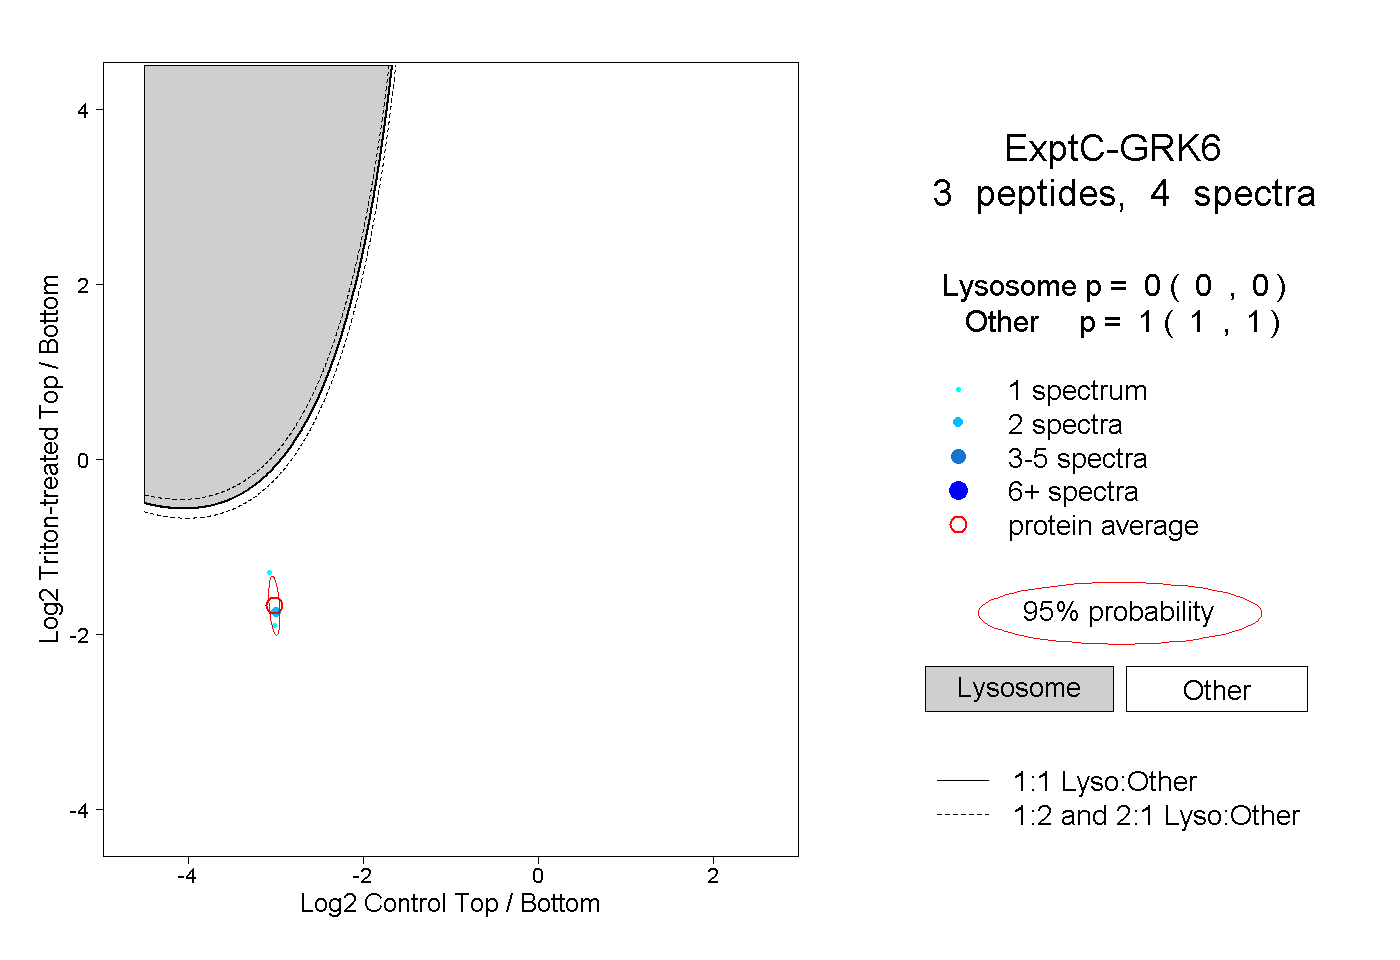 |
0.000 0.000 | 0.000 |
1.000 1.000 | 1.000 |
||||||||
| Plot | Lyso | Other | |||||||||||
| Expt D |
1 peptide |
1 spectrum |
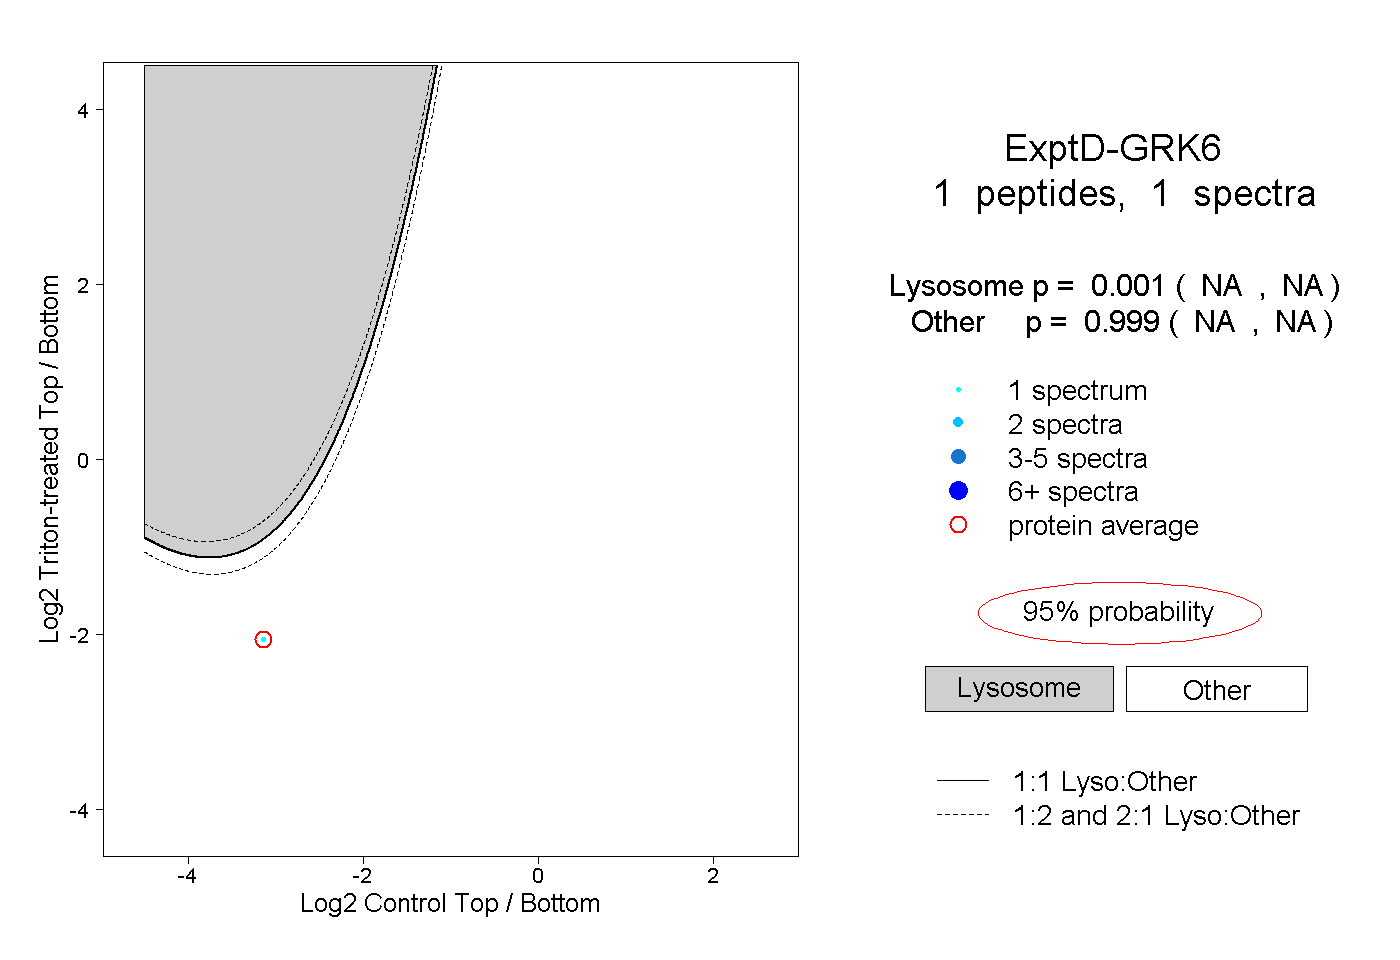 |
0.001 NA | NA |
0.999 NA | NA |