 18
18peptides
spectra
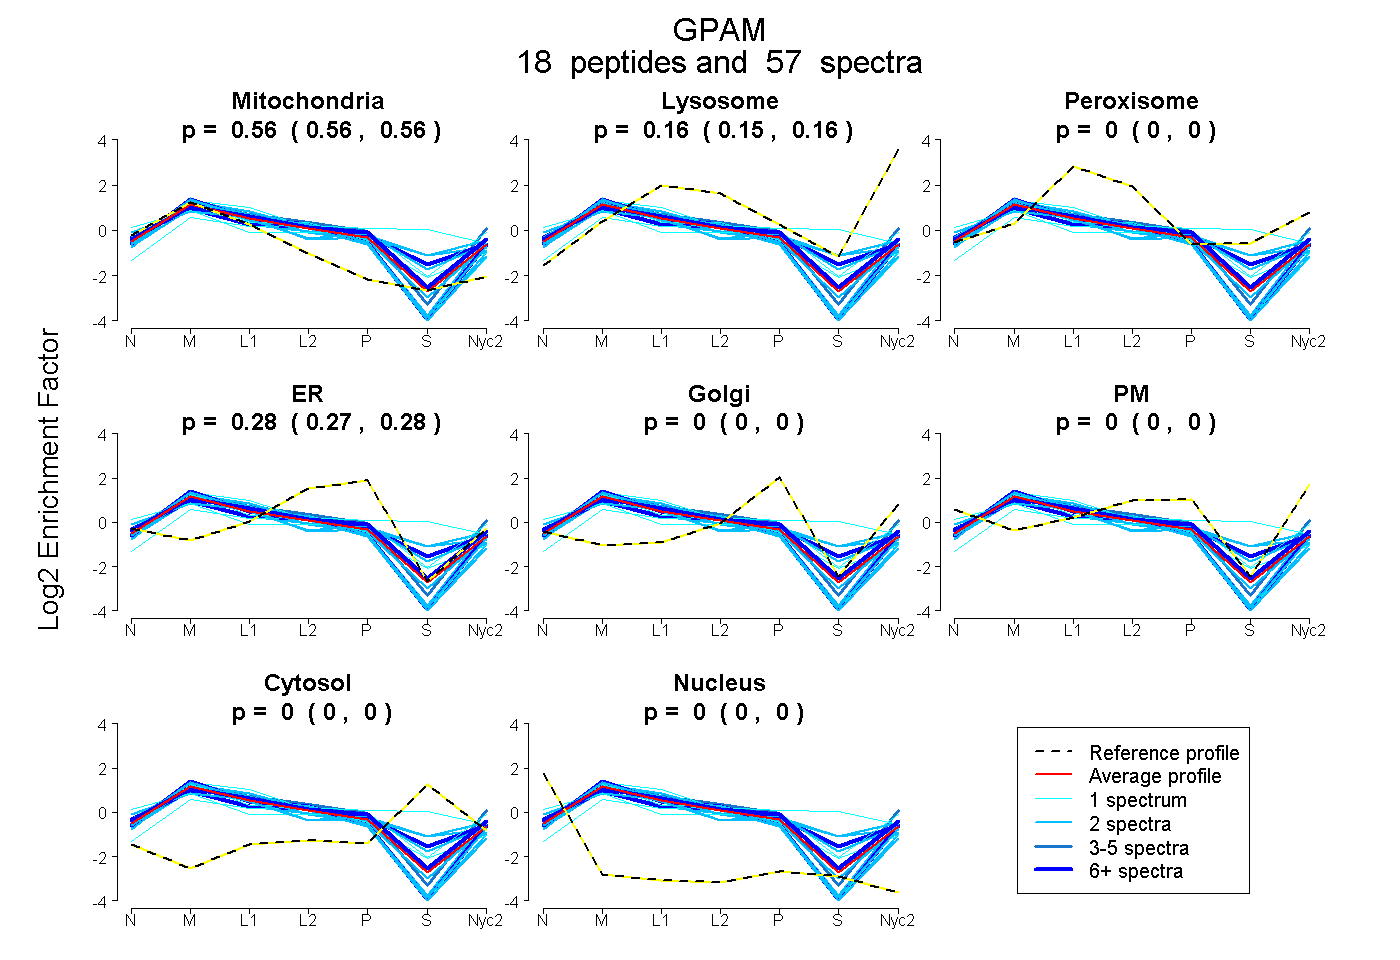
0.560 | 0.565
0.153 | 0.165
0.000 | 0.000
0.272 | 0.282
0.000 | 0.000
0.000 | 0.004
0.000 | 0.000
0.000 | 0.000
12peptides
spectra
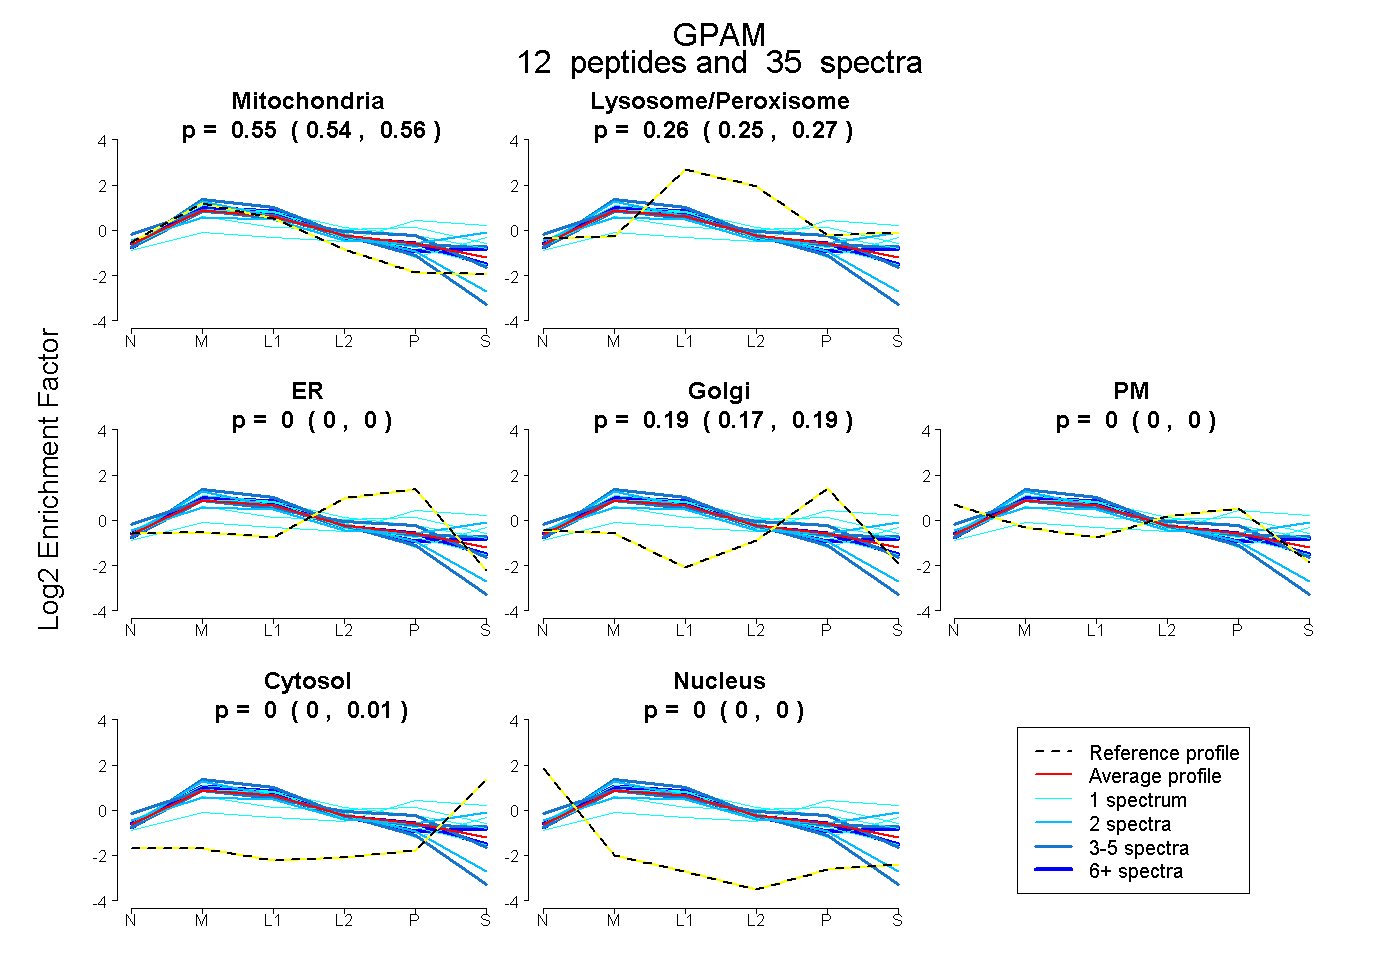
0.536 | 0.564
0.248 | 0.268
0.000 | 0.000
0.174 | 0.195
0.000 | 0.000
0.000 | 0.013
0.000 | 0.000
22peptides
spectra
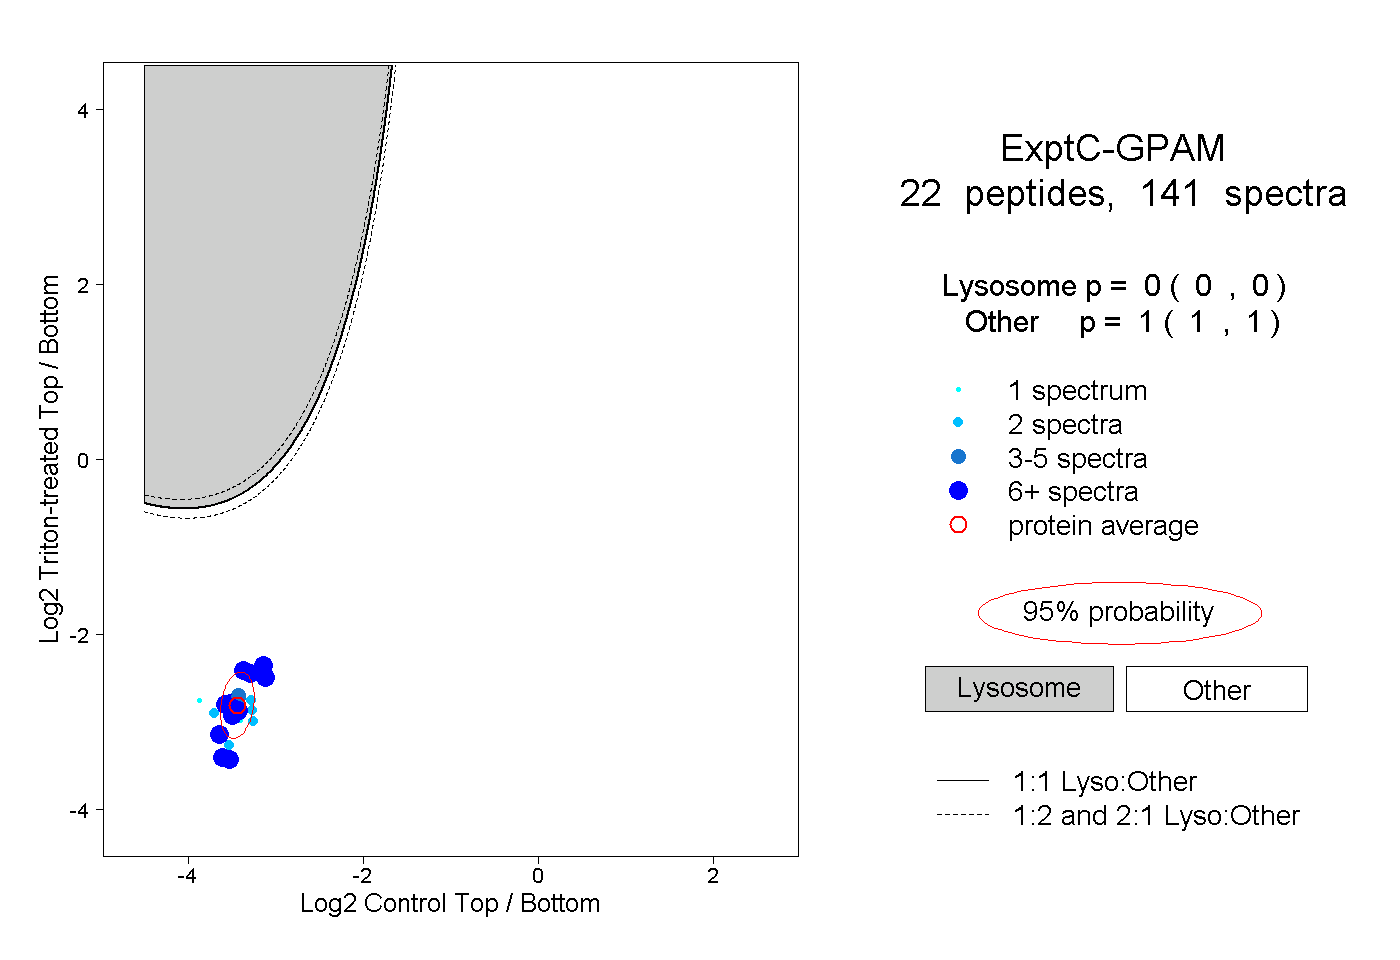
0.000 | 0.000
1.000 | 1.000
9peptides
spectra
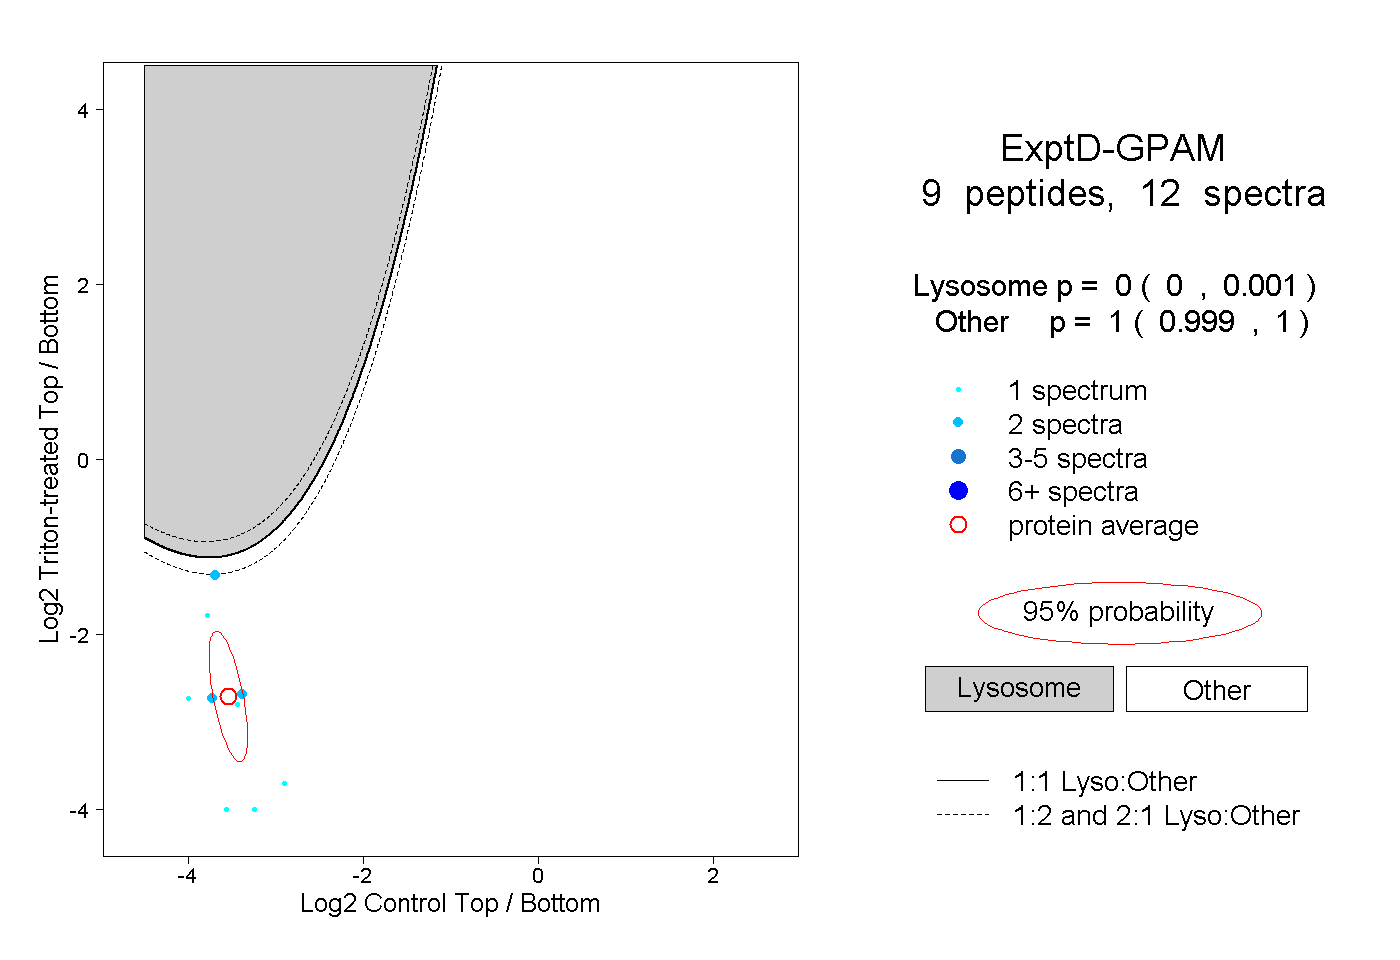
0.000 | 0.001
0.999 | 1.000