 8
8peptides
spectra
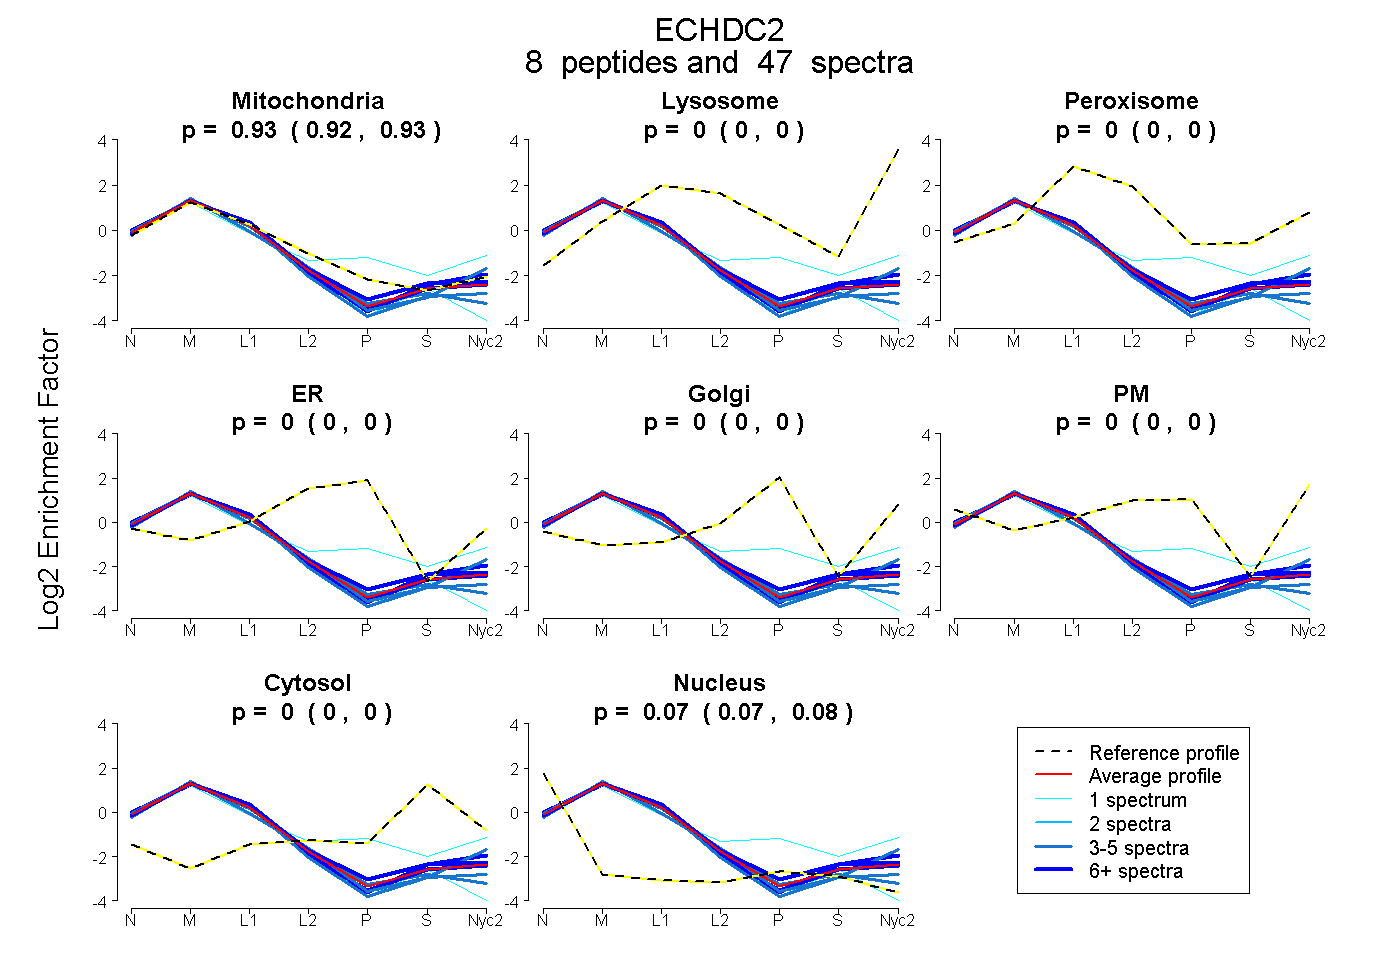
0.922 | 0.928
0.000 | 0.000
0.000 | 0.000
0.000 | 0.000
0.000 | 0.000
0.000 | 0.000
0.000 | 0.000
0.072 | 0.078
7peptides
spectra
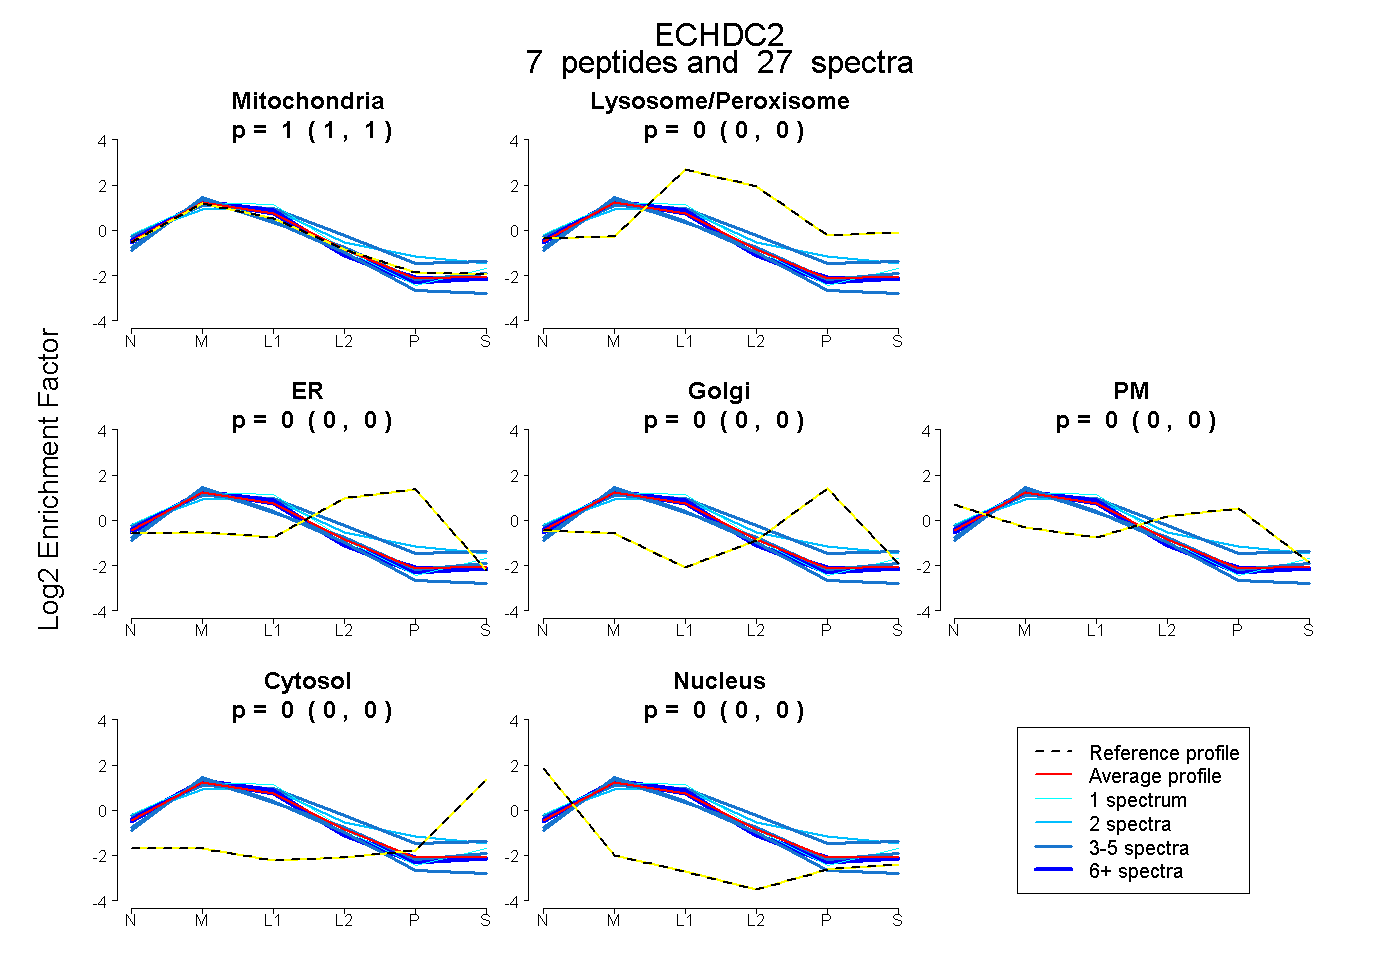
0.998 | 1.000
0.000 | 0.000
0.000 | 0.000
0.000 | 0.000
0.000 | 0.000
0.000 | 0.000
0.000 | 0.000
7peptides
spectra
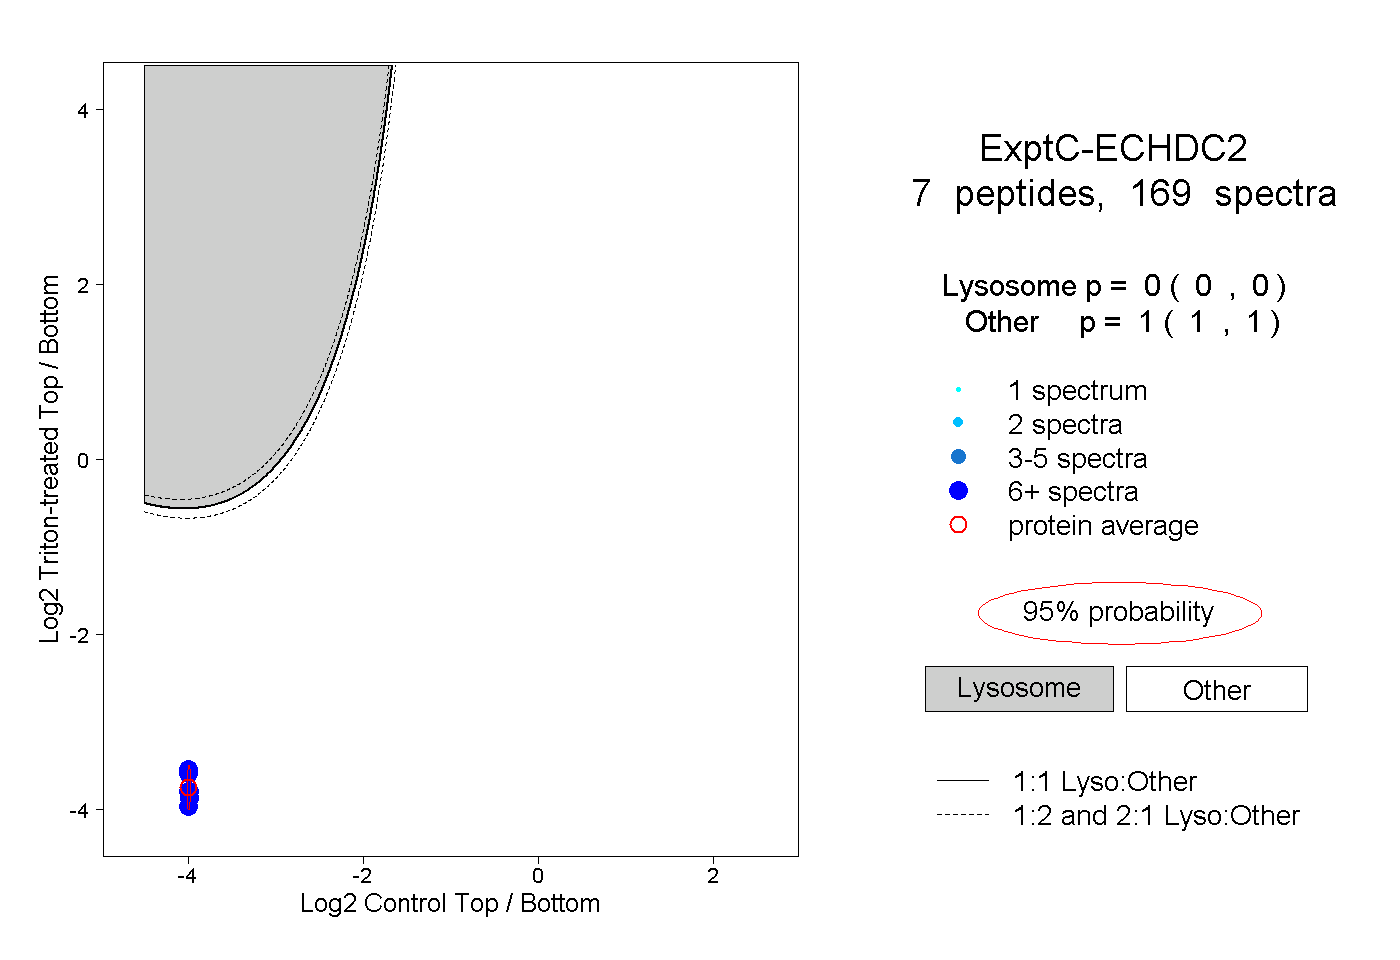
0.000 | 0.000
1.000 | 1.000
3peptides
spectra
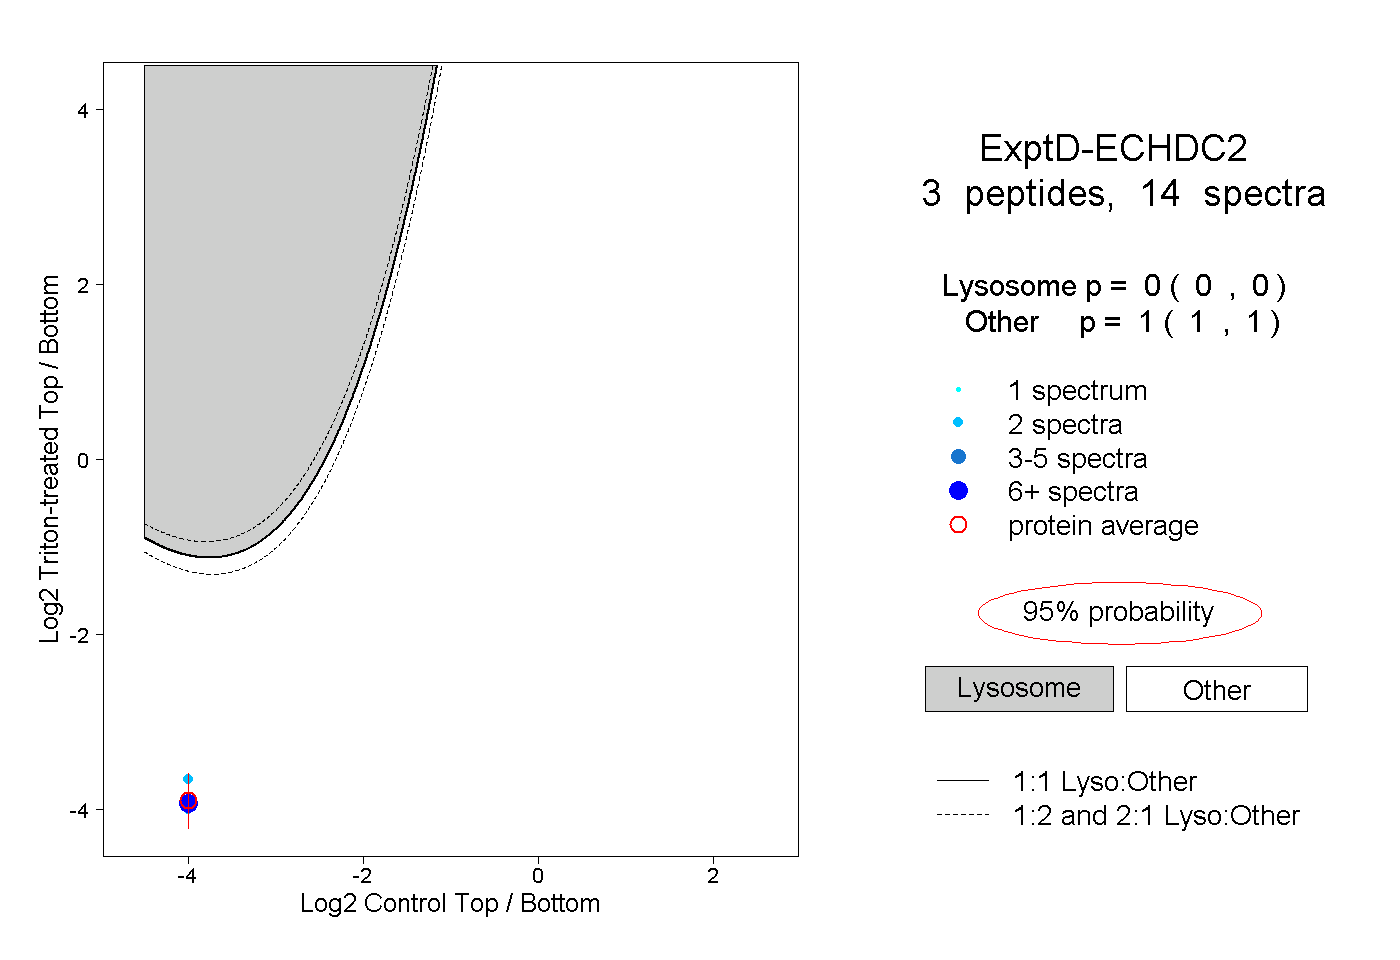
0.000 | 0.000
1.000 | 1.000