 8
8peptides
spectra
0.922 | 0.928
0.000 | 0.000
0.000 | 0.000
0.000 | 0.000
0.000 | 0.000
0.000 | 0.000
0.000 | 0.000
0.072 | 0.078
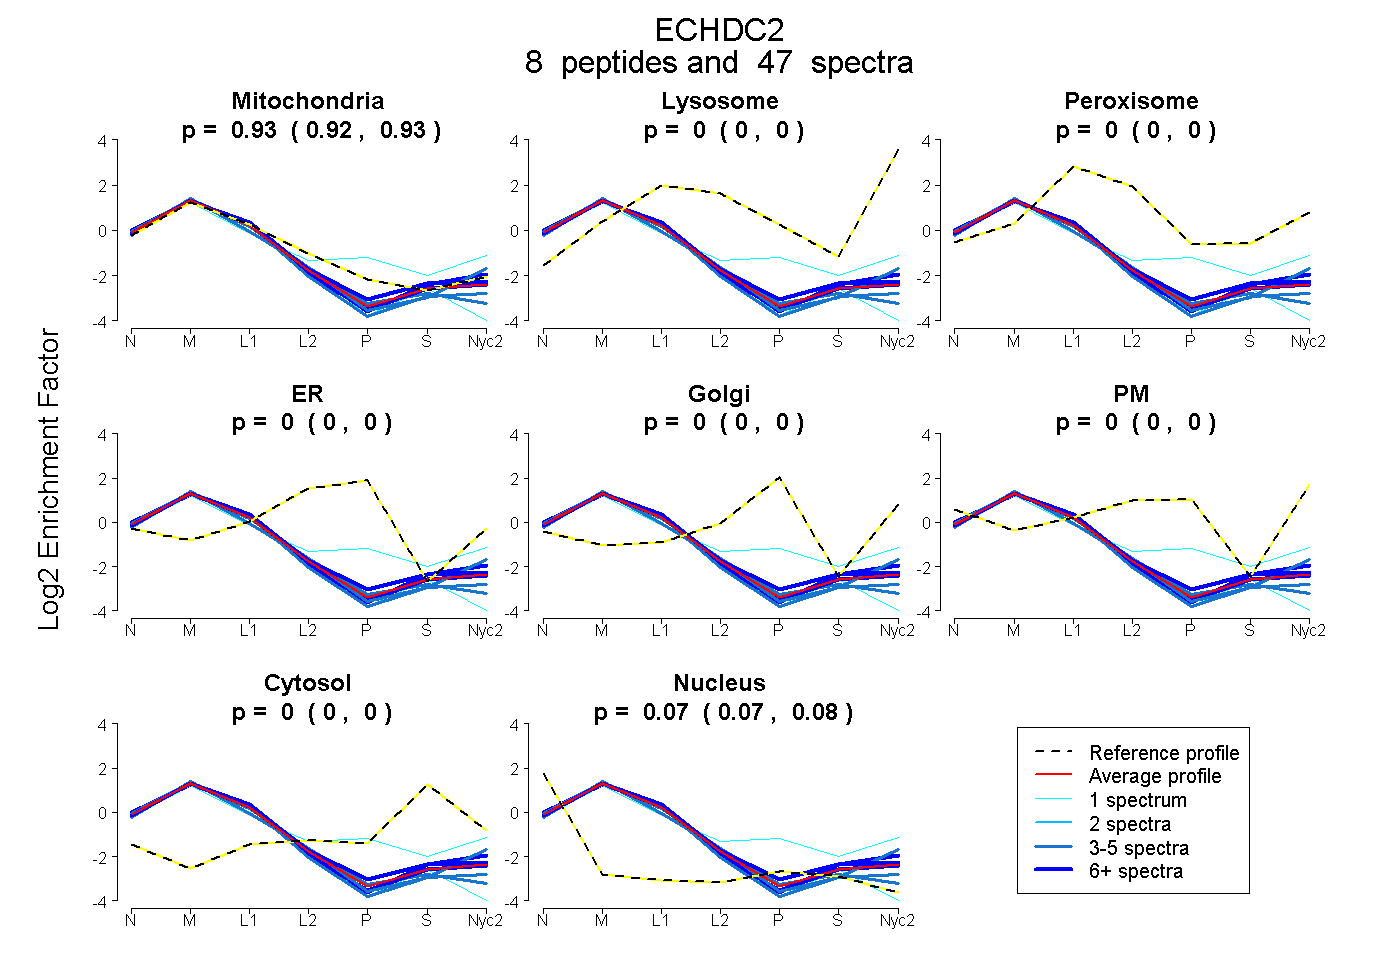
| Plot | Mito | Lyso | Perox | ER | Golgi | PM | Cytosol | Nucleus | |||||
| Expt A |
8 peptides |
47 spectra |
|
0.925 0.922 | 0.928 |
0.000 0.000 | 0.000 |
0.000 0.000 | 0.000 |
0.000 0.000 | 0.000 |
0.000 0.000 | 0.000 |
0.000 0.000 | 0.000 |
0.000 0.000 | 0.000 |
0.075 0.072 | 0.078 |
| 17 spectra, GLLPGAGGTQR | 0.947 | 0.000 | 0.000 | 0.000 | 0.000 | 0.000 | 0.000 | 0.053 | ||
| 6 spectra, ELIFTGR | 0.921 | 0.000 | 0.000 | 0.000 | 0.000 | 0.000 | 0.000 | 0.079 | ||
| 1 spectrum, ALALAQEILPQAPIAVR | 0.872 | 0.000 | 0.000 | 0.000 | 0.000 | 0.000 | 0.000 | 0.128 | ||
| 5 spectra, LEGMAAFR | 0.951 | 0.000 | 0.000 | 0.000 | 0.000 | 0.000 | 0.000 | 0.049 | ||
| 1 spectrum, IAASSAVMGLIETTR | 0.757 | 0.030 | 0.000 | 0.000 | 0.160 | 0.000 | 0.053 | 0.000 | ||
| 5 spectra, EDQQVR | 0.888 | 0.000 | 0.000 | 0.000 | 0.000 | 0.000 | 0.000 | 0.112 | ||
| 9 spectra, MSAAEVGTFVQR | 0.944 | 0.000 | 0.000 | 0.000 | 0.000 | 0.000 | 0.000 | 0.056 | ||
| 3 spectra, GVFCAGADLK | 0.891 | 0.000 | 0.000 | 0.000 | 0.000 | 0.000 | 0.000 | 0.109 |
| Plot | Mito | Lyso or Perox | ER | Golgi | PM | Cytosol | Nucleus | ||||||
| Expt B |
7 peptides |
27 spectra |
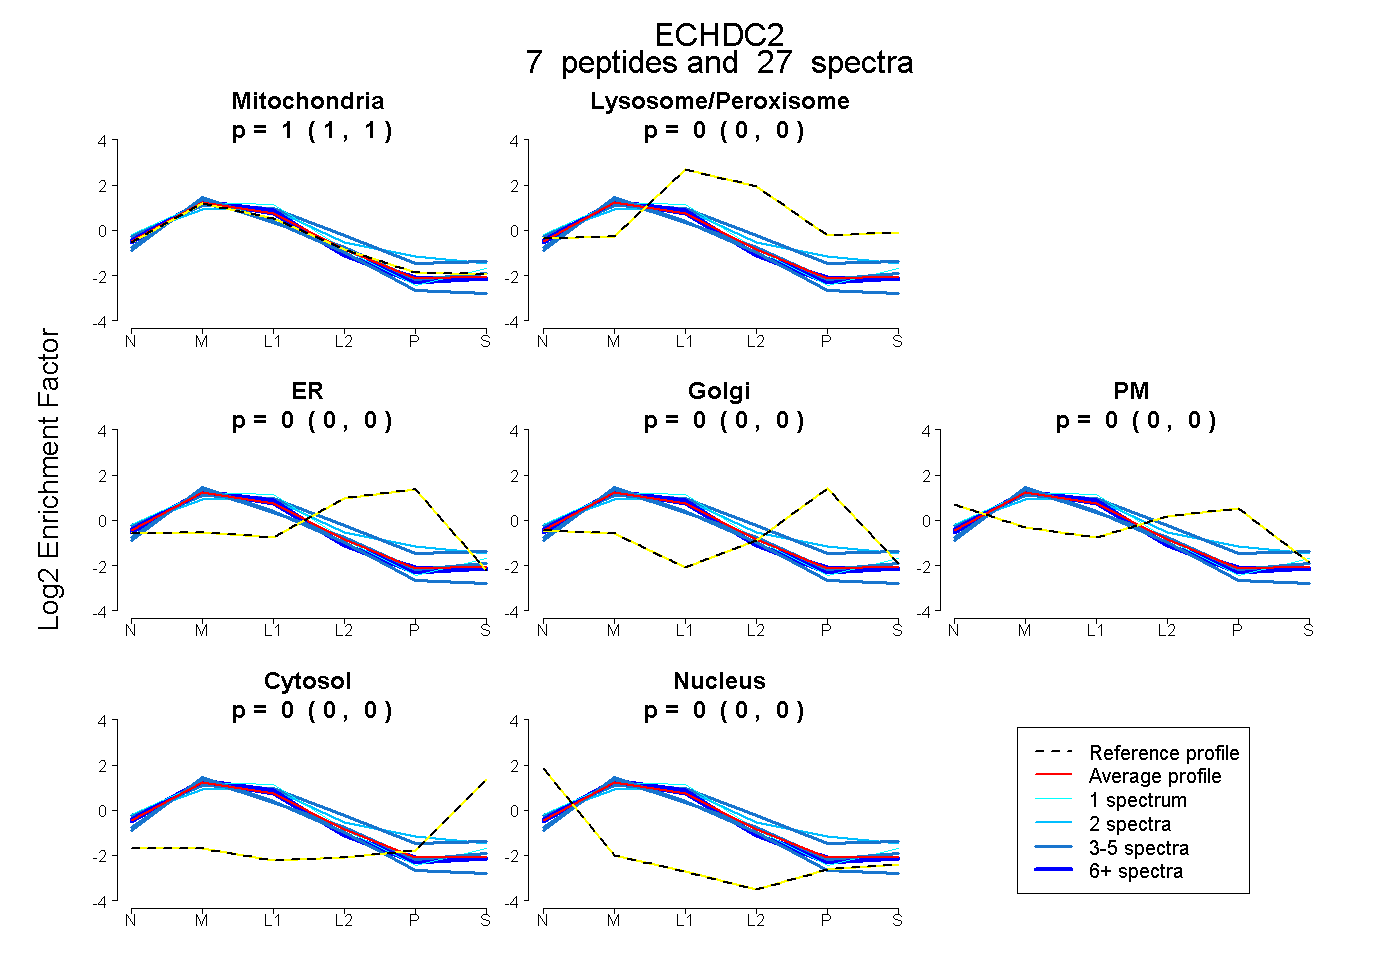 |
1.000 0.998 | 1.000 |
0.000 0.000 | 0.000 |
0.000 0.000 | 0.000 |
0.000 0.000 | 0.000 |
0.000 0.000 | 0.000 |
0.000 0.000 | 0.000 |
0.000 0.000 | 0.000 |
|||
| Plot | Lyso | Other | |||||||||||
| Expt C |
7 peptides |
169 spectra |
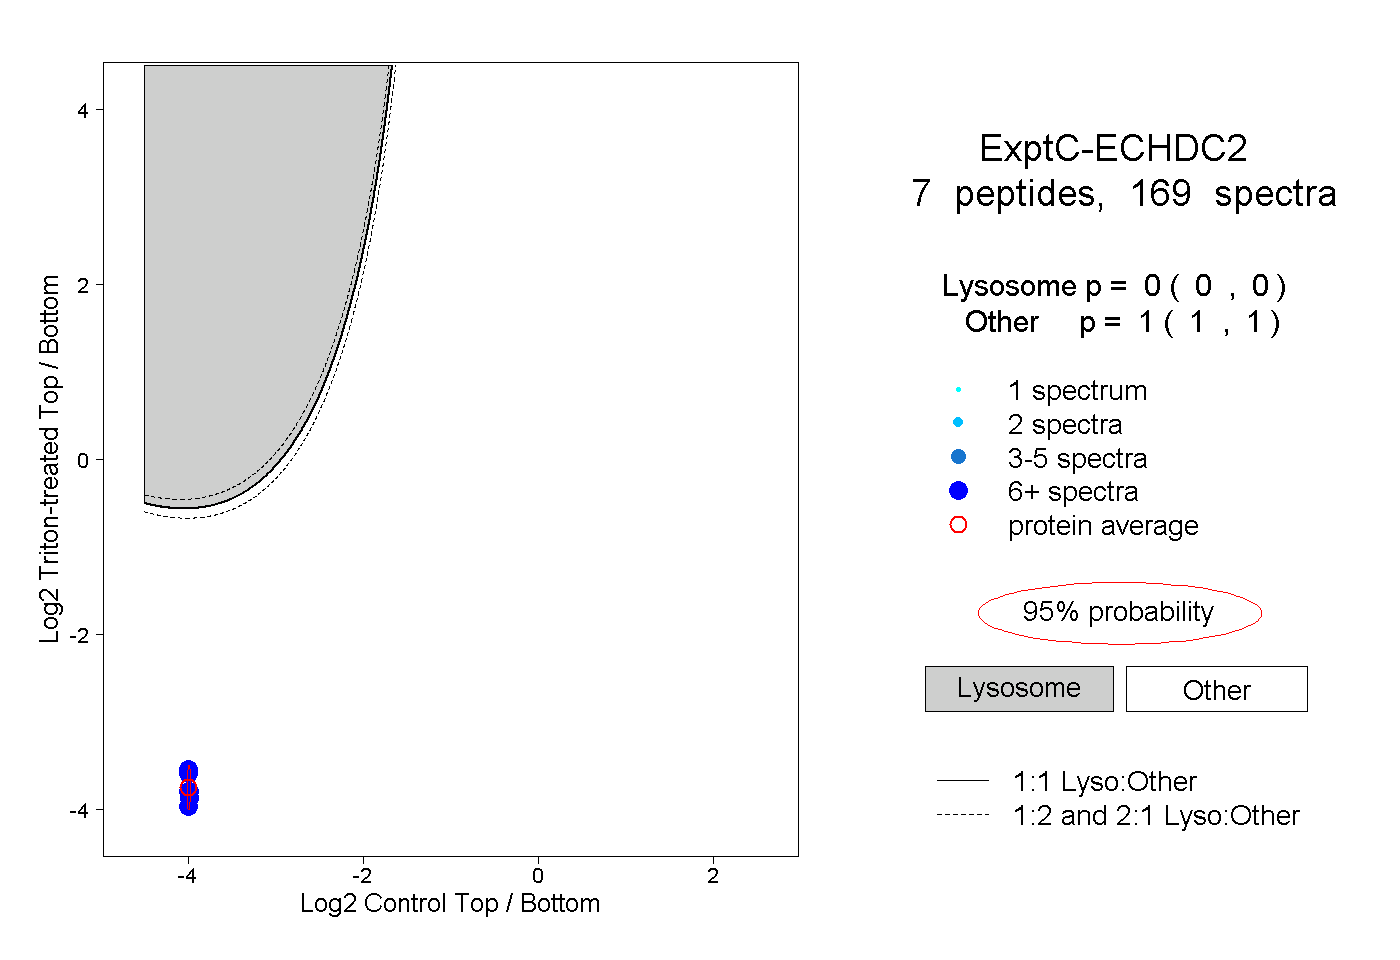 |
0.000 0.000 | 0.000 |
1.000 1.000 | 1.000 |
||||||||
| Plot | Lyso | Other | |||||||||||
| Expt D |
3 peptides |
14 spectra |
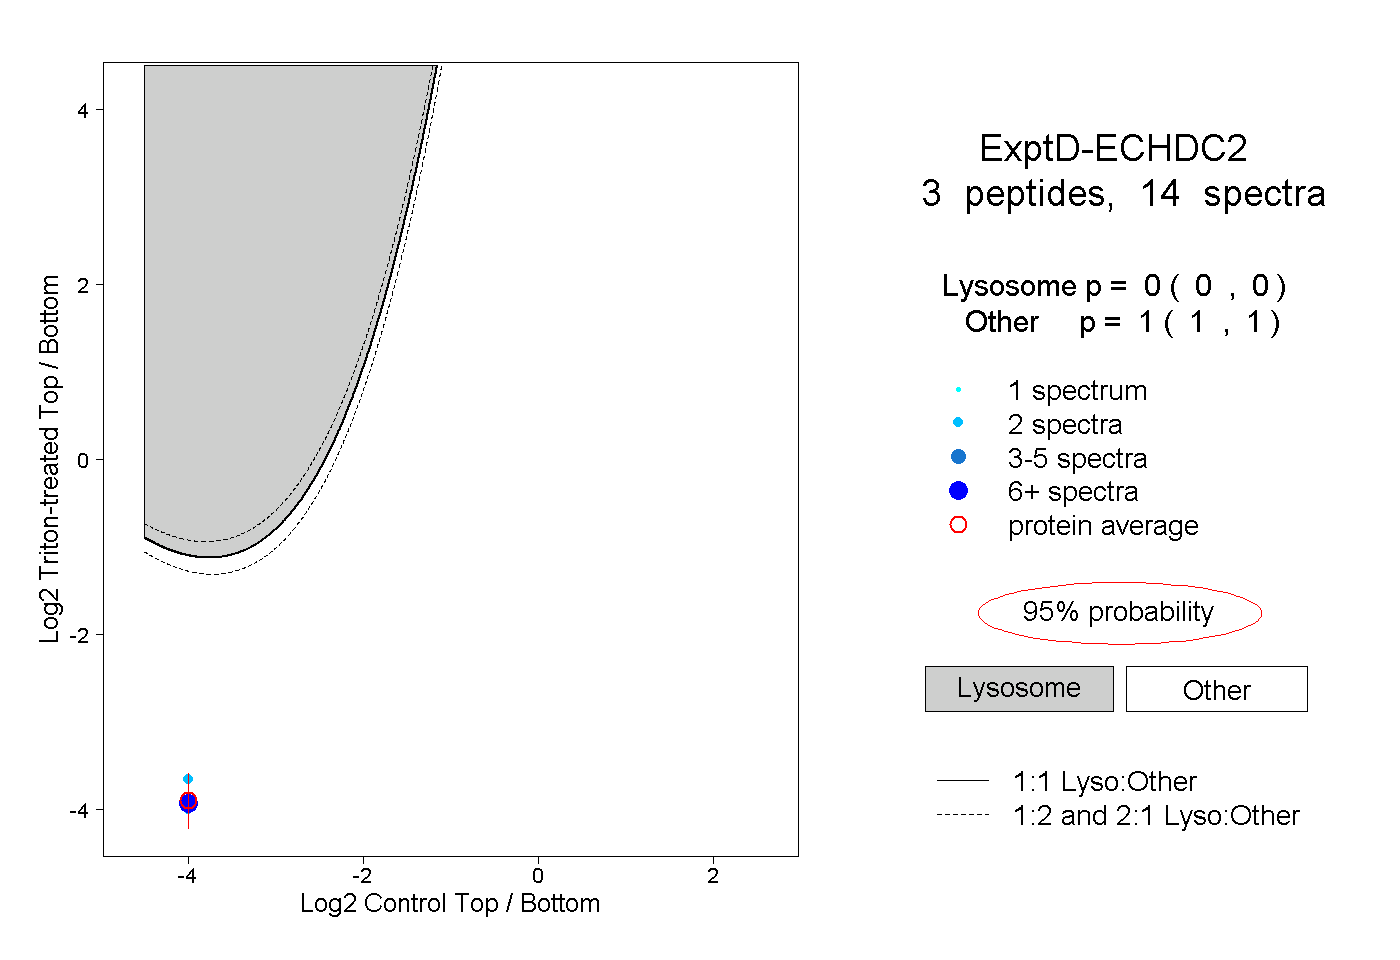 |
0.000 0.000 | 0.000 |
1.000 1.000 | 1.000 |