 10
10peptides
spectra
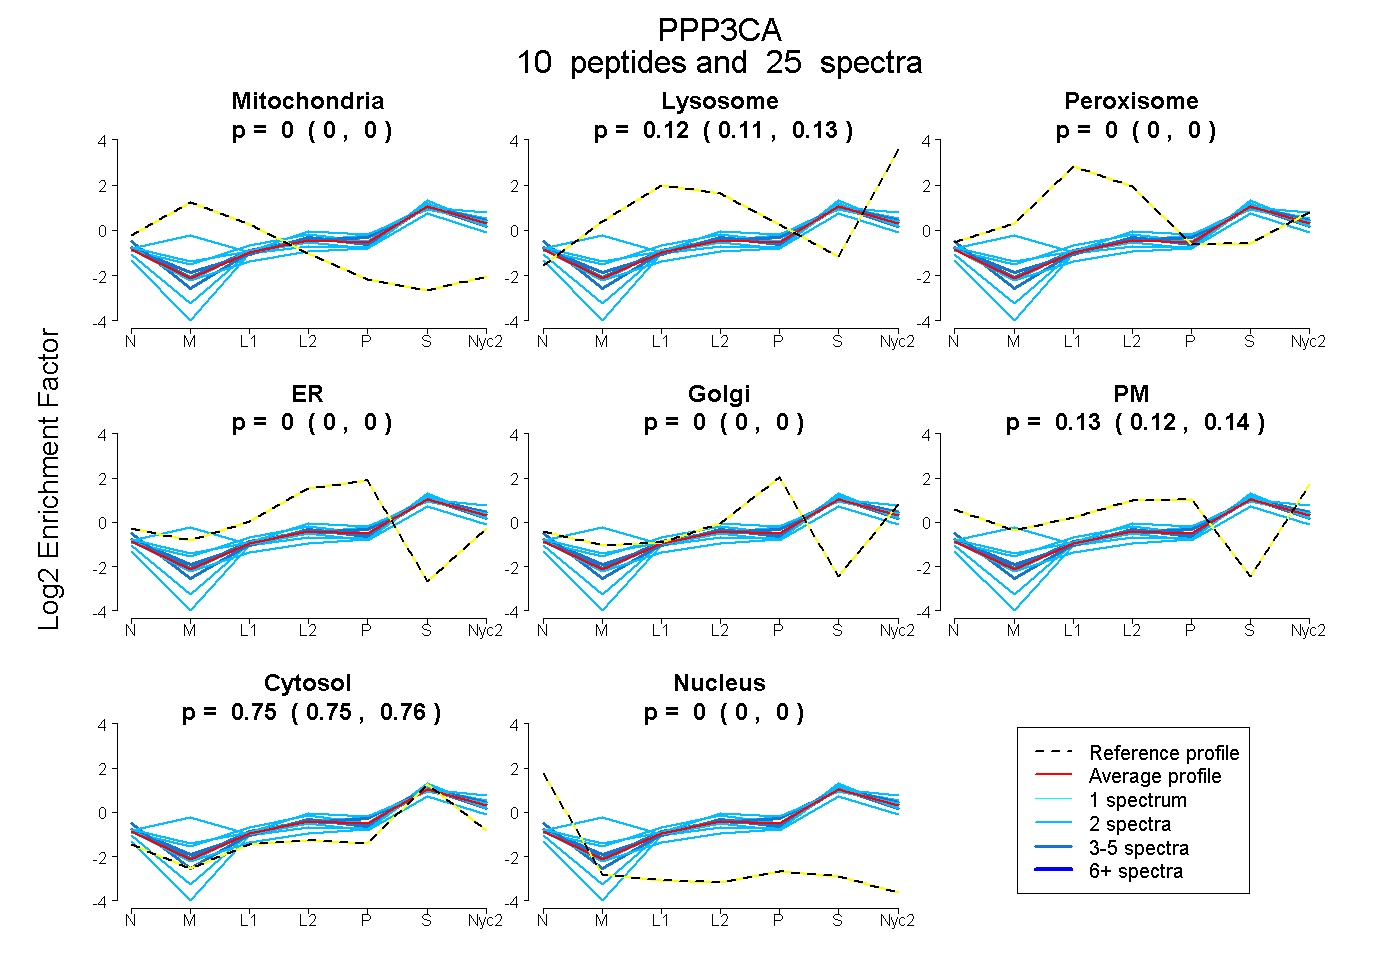
0.000 | 0.000
0.108 | 0.125
0.000 | 0.000
0.000 | 0.000
0.000 | 0.000
0.122 | 0.135
0.746 | 0.759
0.000 | 0.000
4peptides
spectra
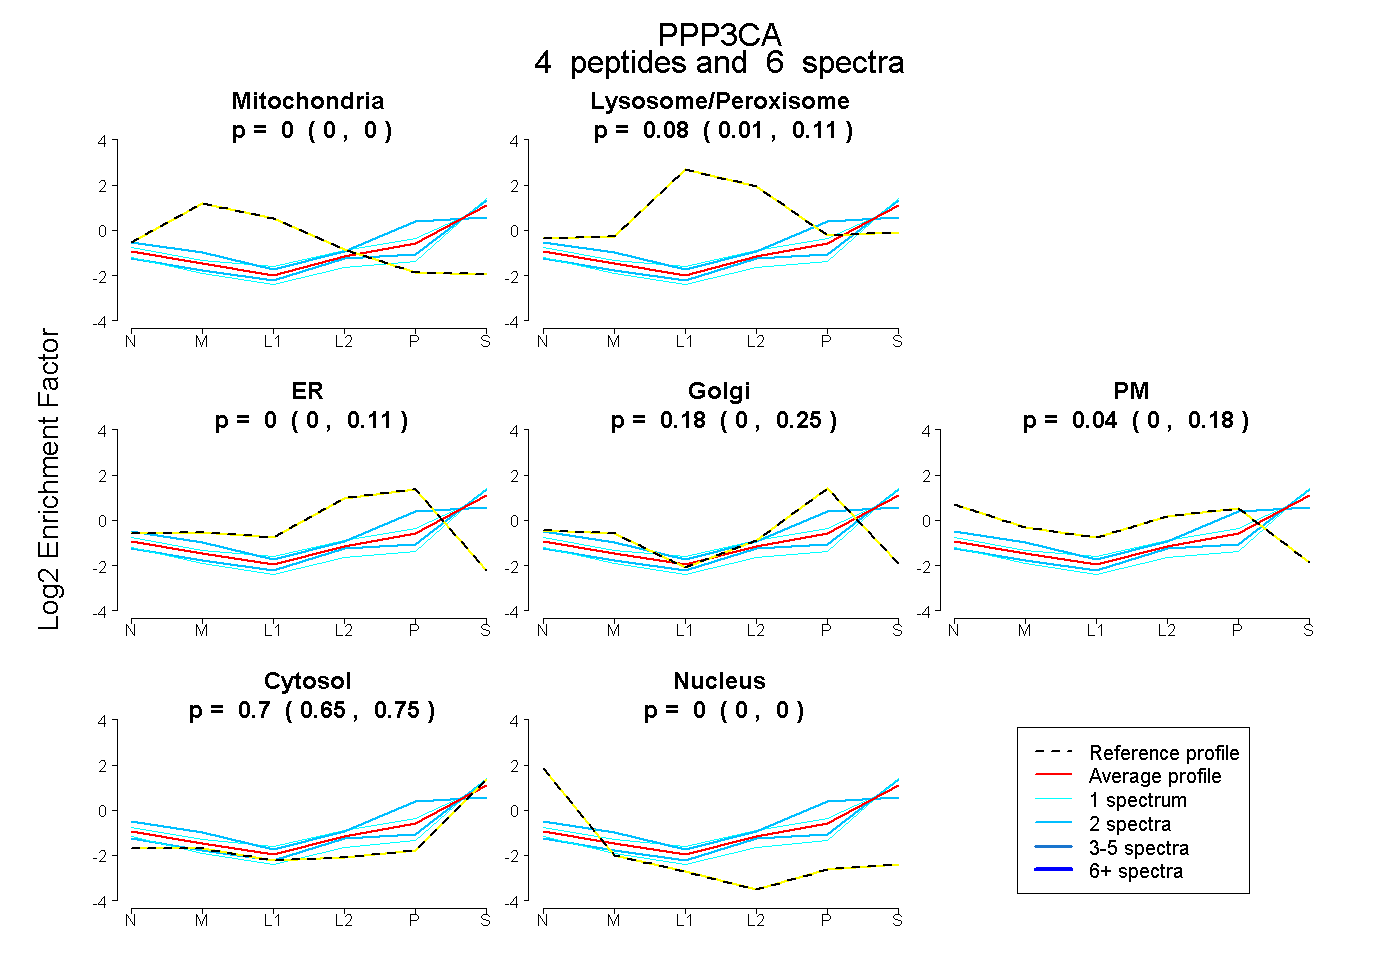
0.000 | 0.000
0.009 | 0.107
0.000 | 0.105
0.000 | 0.249
0.000 | 0.178
0.645 | 0.752
0.000 | 0.000
11peptides
spectra
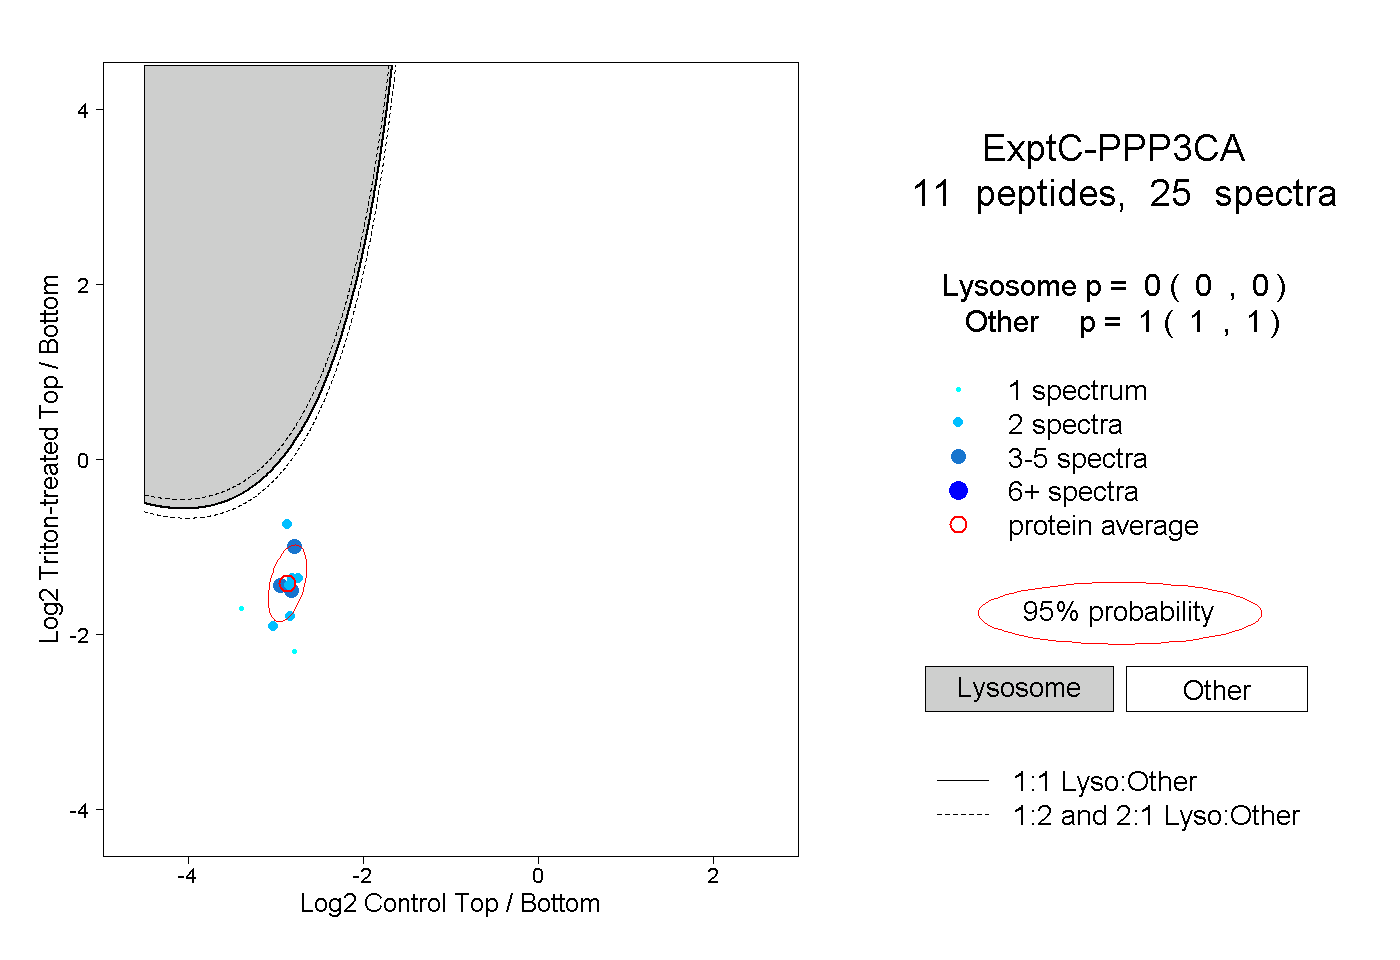
0.000 | 0.000
1.000 | 1.000
1peptide
spectra
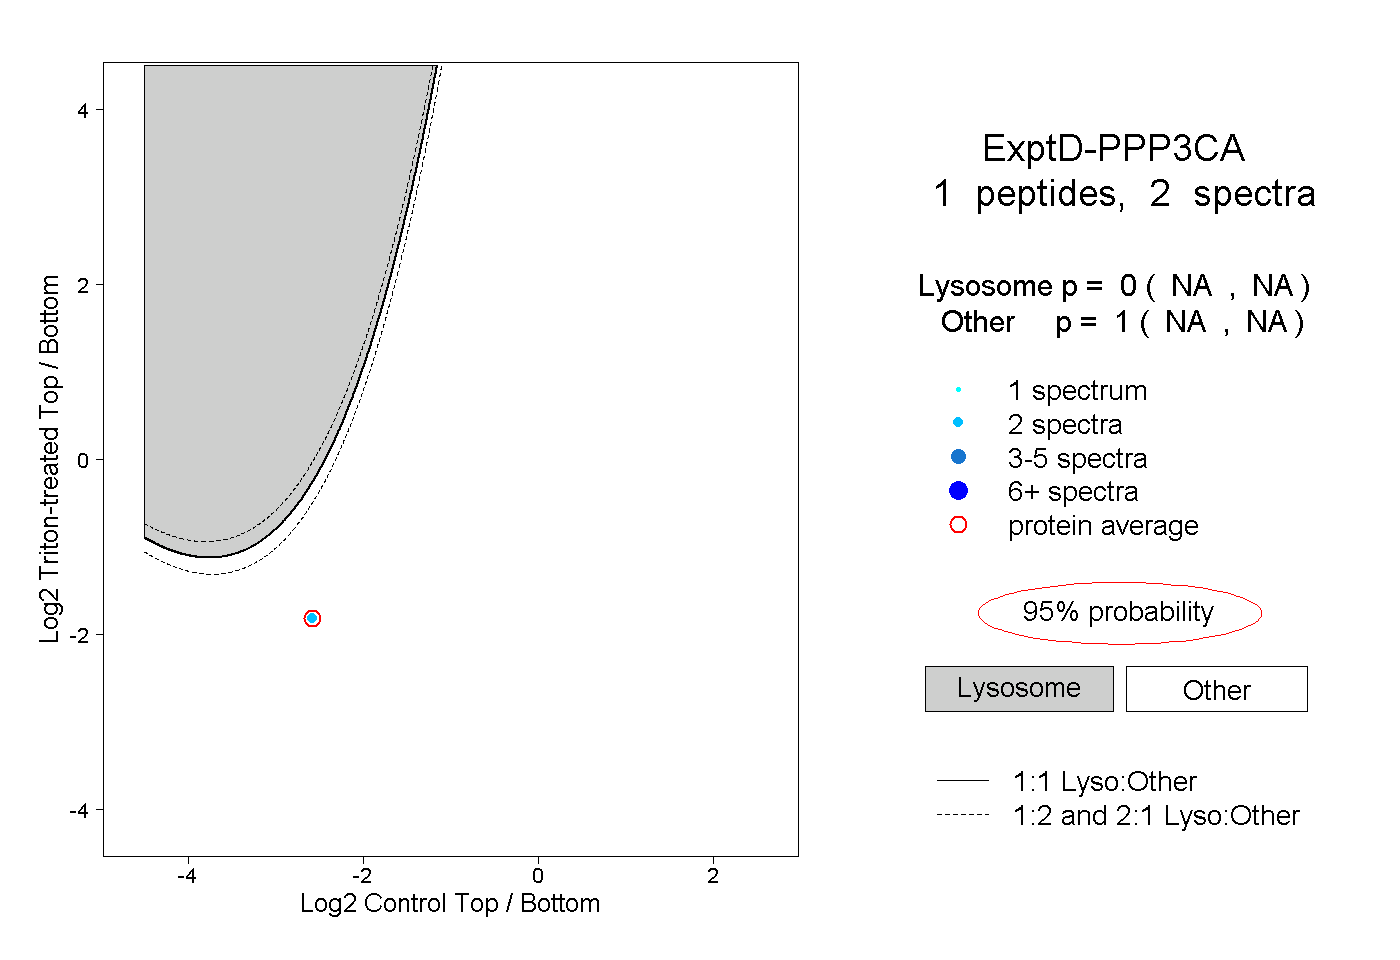
NA | NA
NA | NA