 10
10peptides
spectra
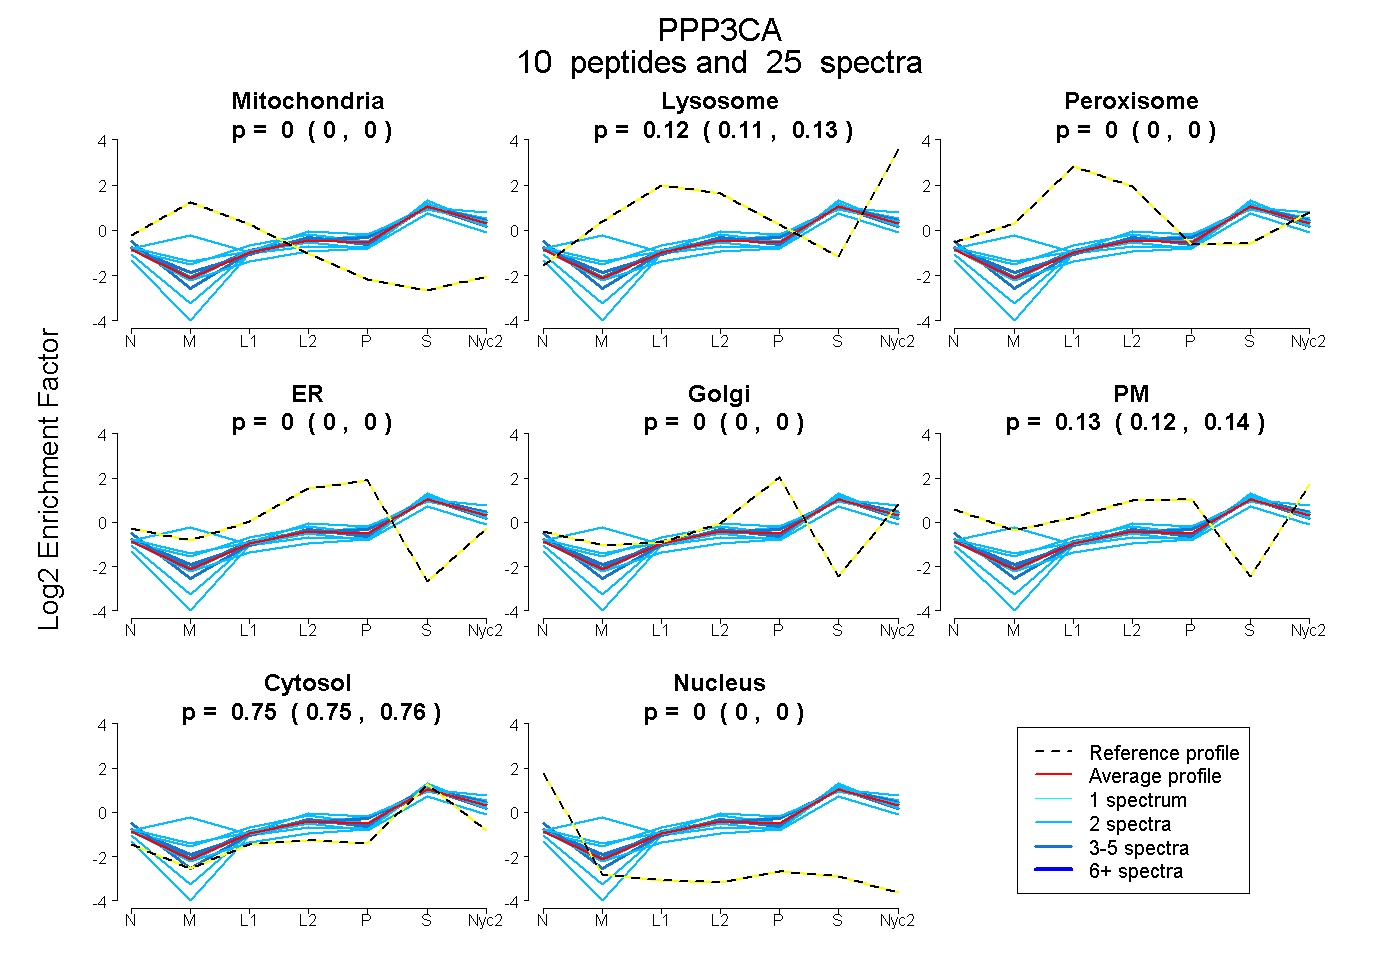
0.000 | 0.000
0.108 | 0.125
0.000 | 0.000
0.000 | 0.000
0.000 | 0.000
0.122 | 0.135
0.746 | 0.759
0.000 | 0.000
| Plot | Mito | Lyso | Perox | ER | Golgi | PM | Cytosol | Nucleus | |||||
| Expt A |
10 peptides |
25 spectra |
|
0.000 0.000 | 0.000 |
0.117 0.108 | 0.125 |
0.000 0.000 | 0.000 |
0.000 0.000 | 0.000 |
0.000 0.000 | 0.000 |
0.129 0.122 | 0.135 |
0.753 0.746 | 0.759 |
0.000 0.000 | 0.000 |
| 2 spectra, EVFDNDGKPR | 0.000 | 0.098 | 0.000 | 0.014 | 0.034 | 0.029 | 0.826 | 0.000 | ||
| 3 spectra, ITSFEEAK | 0.000 | 0.141 | 0.000 | 0.000 | 0.000 | 0.123 | 0.736 | 0.000 | ||
| 2 spectra, VFSVLR | 0.000 | 0.156 | 0.000 | 0.000 | 0.000 | 0.188 | 0.656 | 0.000 | ||
| 2 spectra, QTLQSAIK | 0.177 | 0.178 | 0.000 | 0.000 | 0.000 | 0.051 | 0.593 | 0.000 | ||
| 2 spectra, IITEGASILR | 0.000 | 0.140 | 0.000 | 0.000 | 0.050 | 0.096 | 0.714 | 0.000 | ||
| 2 spectra, LFEVGGSPANTR | 0.000 | 0.264 | 0.000 | 0.000 | 0.000 | 0.069 | 0.666 | 0.000 | ||
| 2 spectra, YLFLGDYVDR | 0.000 | 0.047 | 0.000 | 0.000 | 0.000 | 0.119 | 0.834 | 0.000 | ||
| 4 spectra, AHEAQDAGYR | 0.000 | 0.104 | 0.001 | 0.000 | 0.000 | 0.141 | 0.754 | 0.000 | ||
| 2 spectra, GLTPTGMLPSGVLSGGK | 0.000 | 0.071 | 0.000 | 0.000 | 0.012 | 0.000 | 0.917 | 0.000 | ||
| 4 spectra, LSTTDR | 0.000 | 0.033 | 0.000 | 0.000 | 0.000 | 0.224 | 0.743 | 0.000 |
| Plot | Mito | Lyso or Perox | ER | Golgi | PM | Cytosol | Nucleus | ||||||
| Expt B |
4 peptides |
6 spectra |
 |
0.000 0.000 | 0.000 |
0.083 0.009 | 0.107 |
0.000 0.000 | 0.105 |
0.181 0.000 | 0.249 |
0.039 0.000 | 0.178 |
0.696 0.645 | 0.752 |
0.000 0.000 | 0.000 |
|||
| Plot | Lyso | Other | |||||||||||
| Expt C |
11 peptides |
25 spectra |
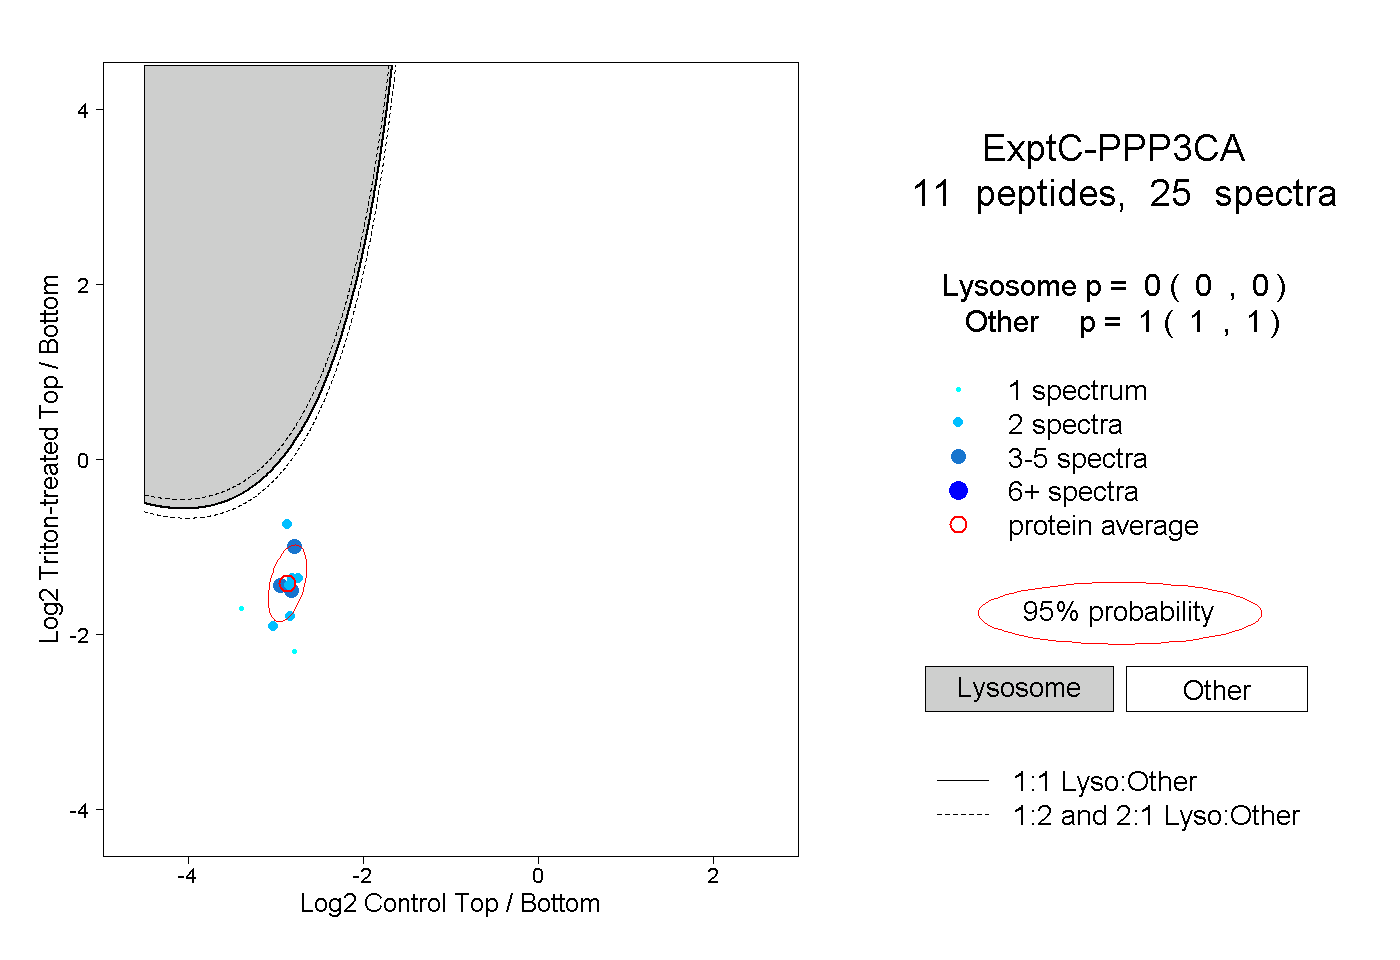 |
0.000 0.000 | 0.000 |
1.000 1.000 | 1.000 |
||||||||
| Plot | Lyso | Other | |||||||||||
| Expt D |
1 peptide |
2 spectra |
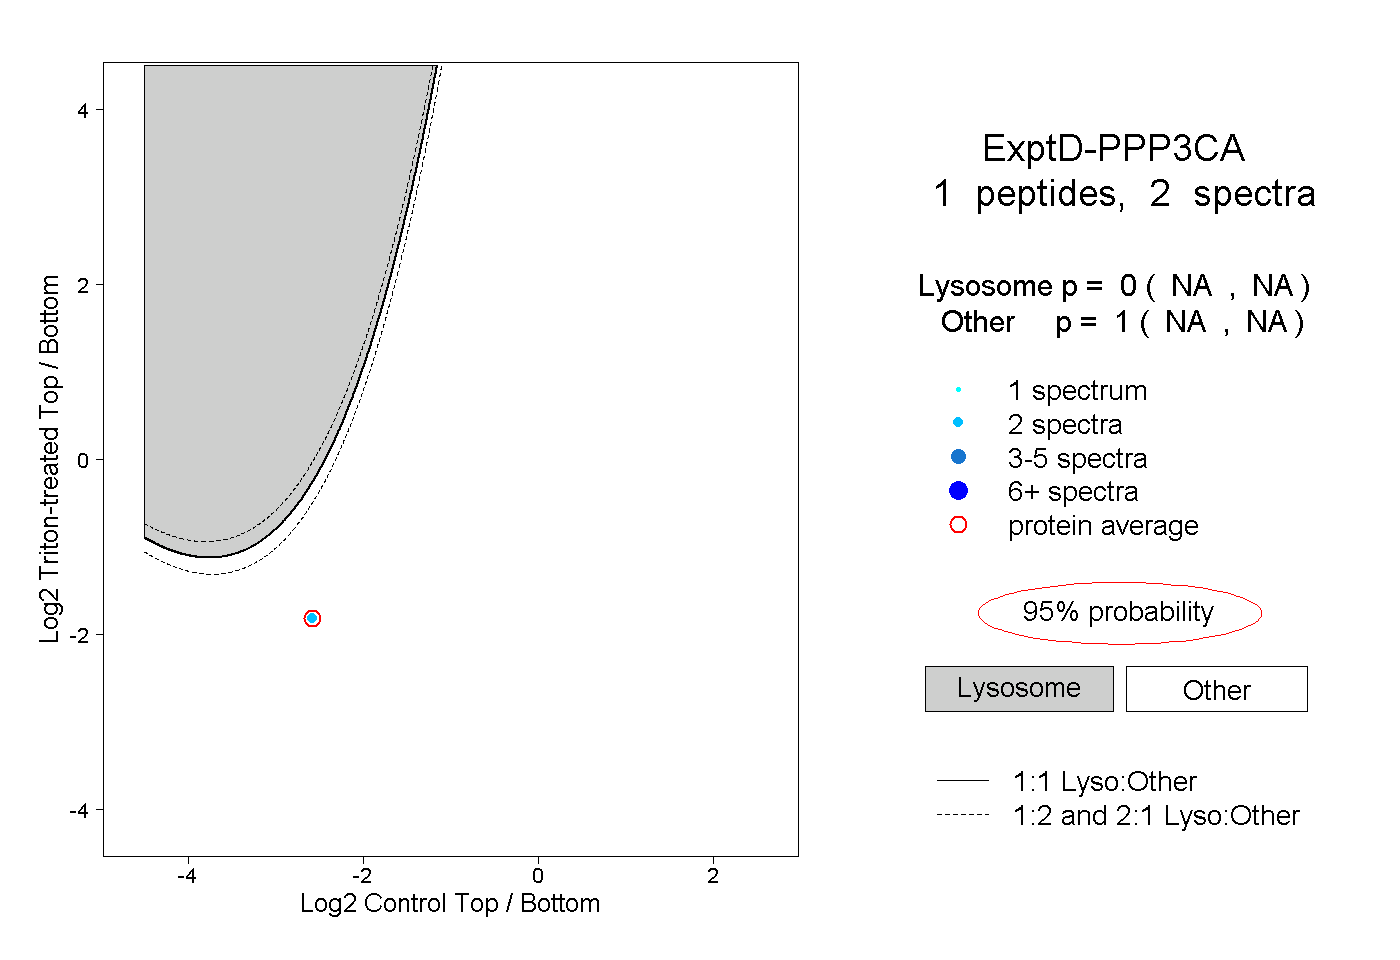 |
0.000 NA | NA |
1.000 NA | NA |