 41
41peptides
spectra
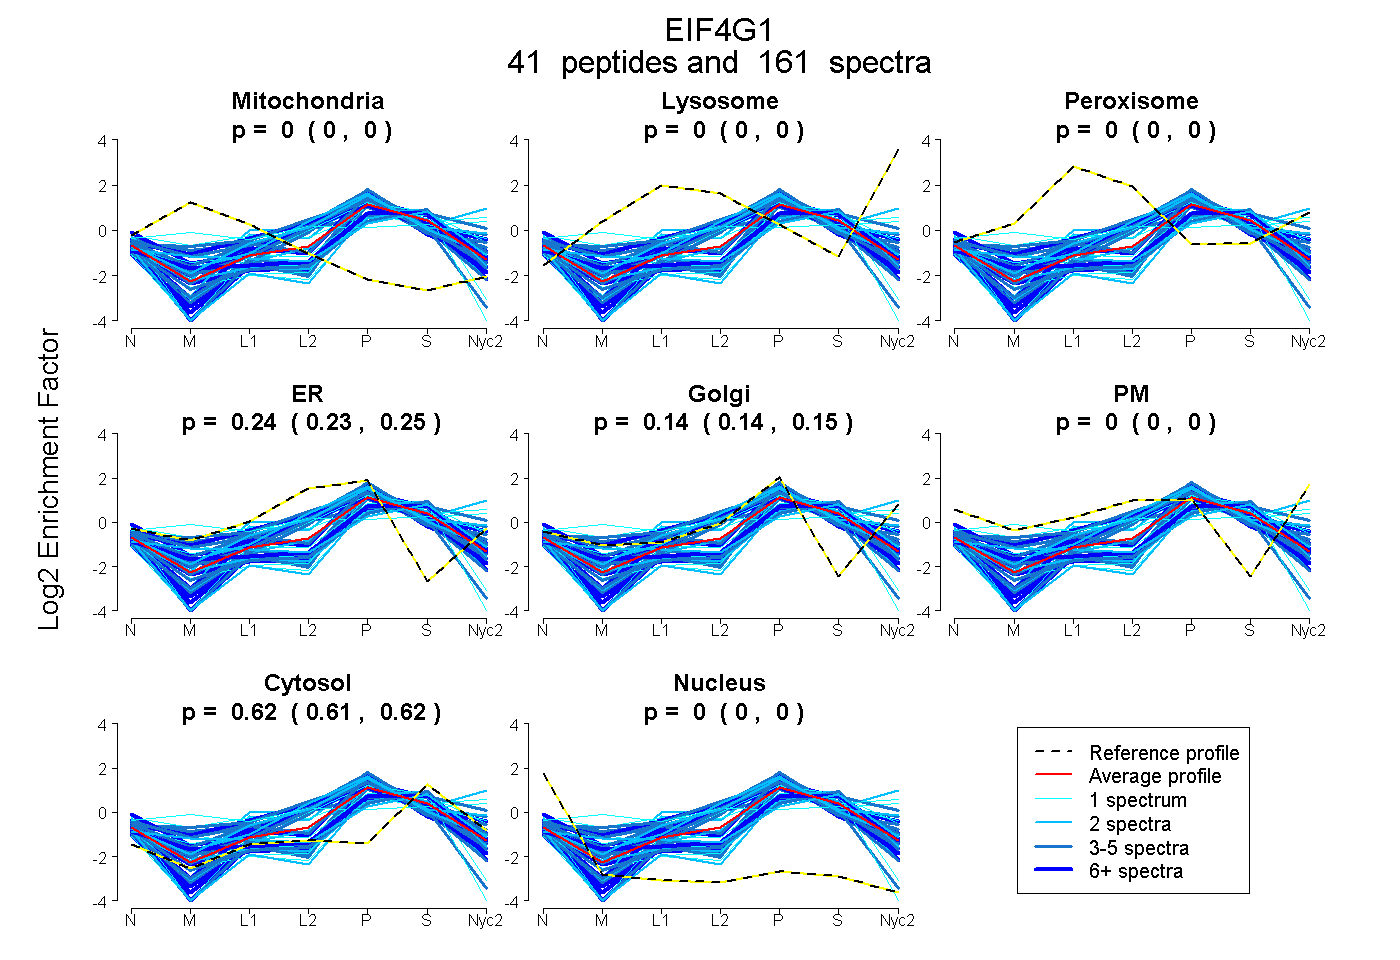
0.000 | 0.000
0.000 | 0.000
0.000 | 0.000
0.229 | 0.246
0.135 | 0.153
0.000 | 0.000
0.614 | 0.618
0.000 | 0.002
18peptides
spectra
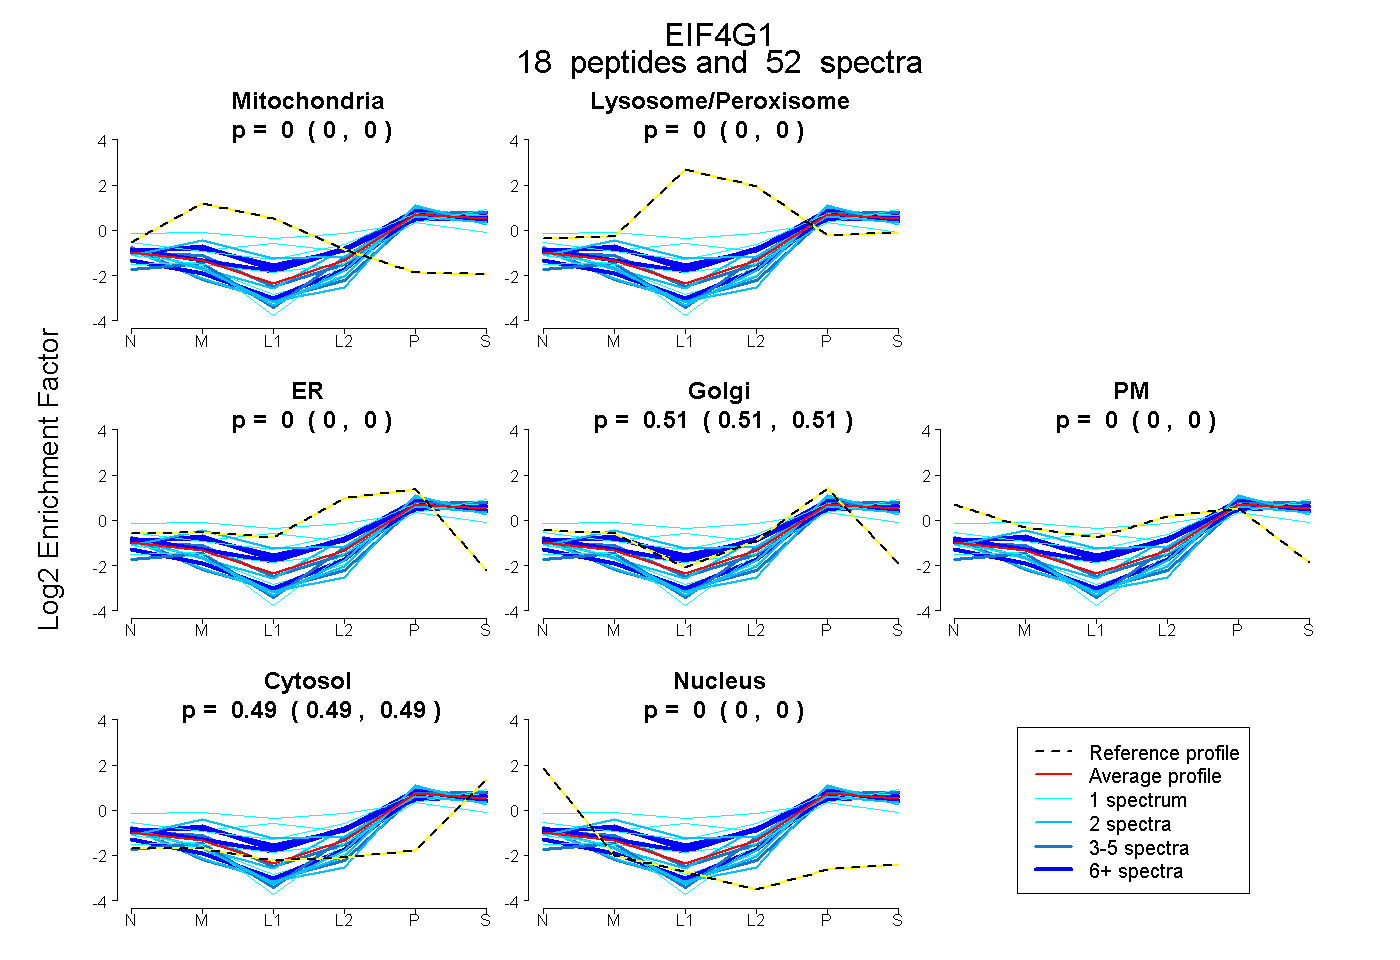
0.000 | 0.000
0.000 | 0.000
0.000 | 0.000
0.506 | 0.513
0.000 | 0.000
0.486 | 0.493
0.000 | 0.000
34peptides
spectra
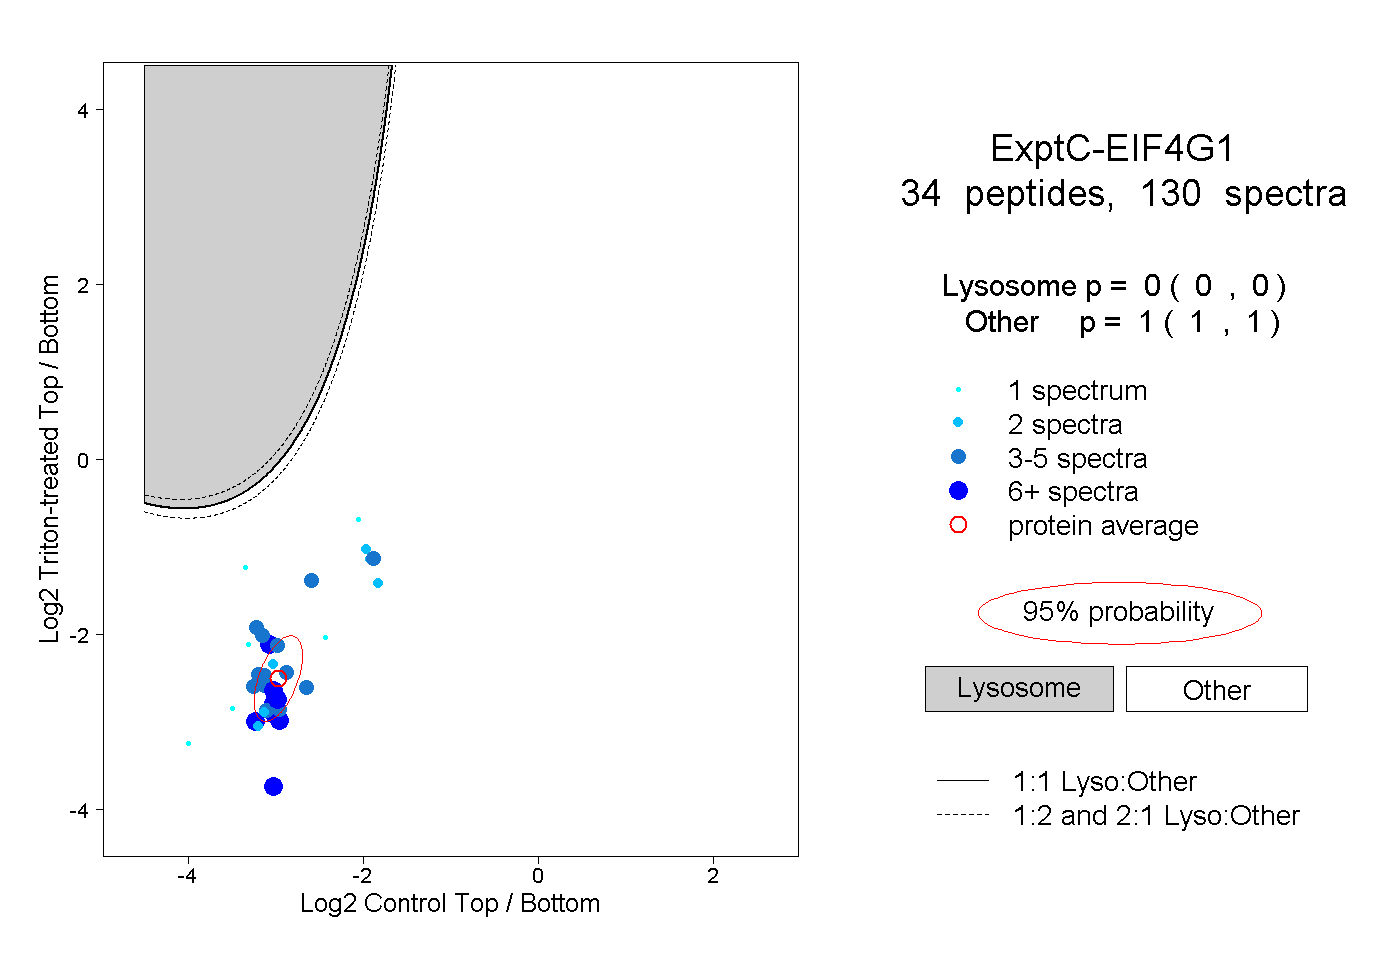
0.000 | 0.000
1.000 | 1.000
15peptides
spectra
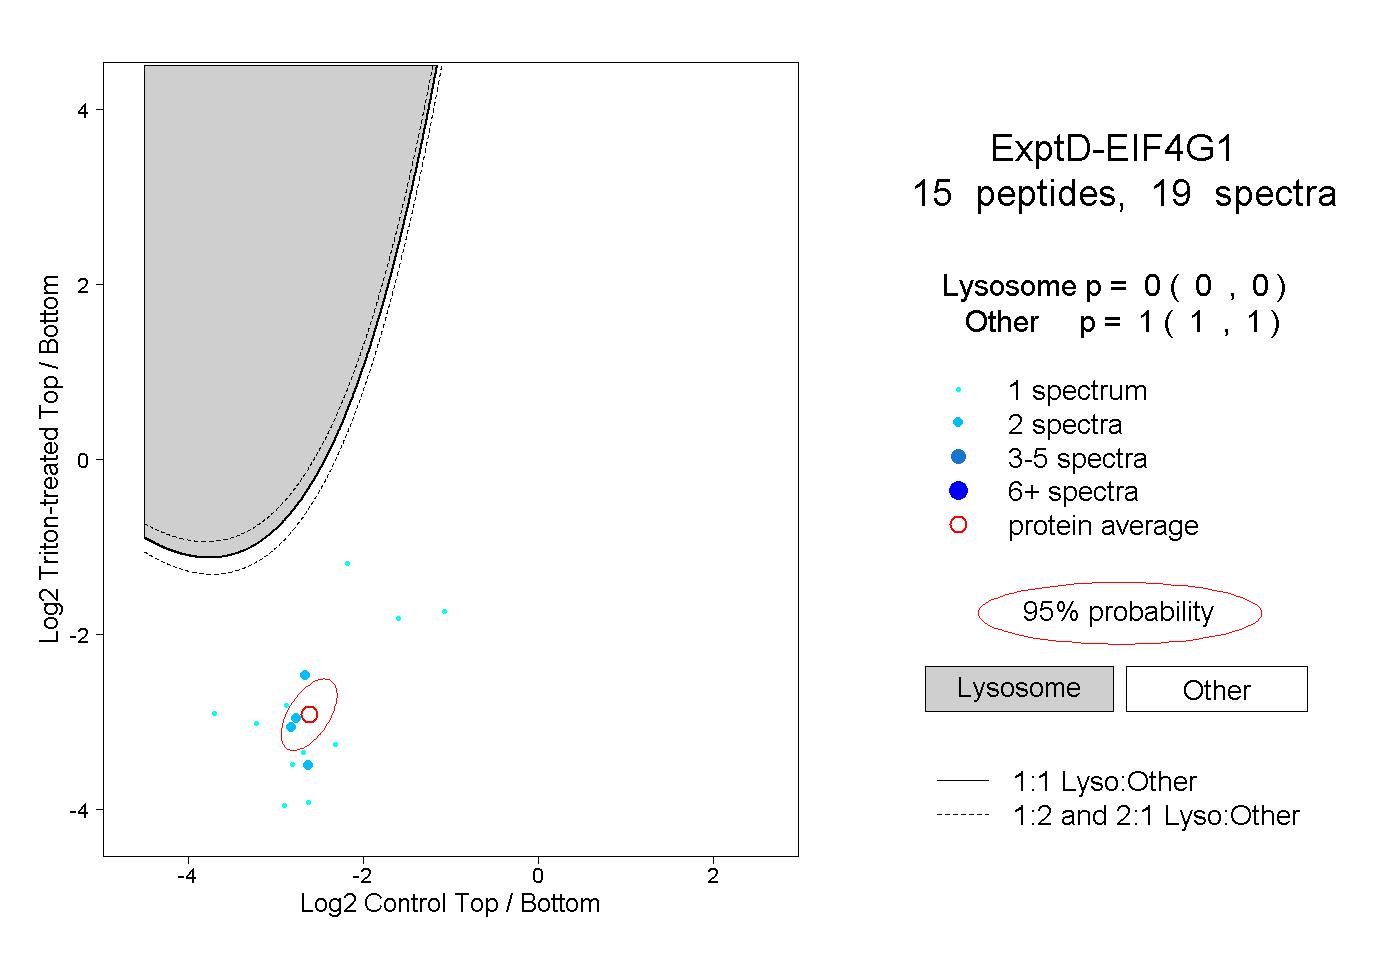
0.000 | 0.000
1.000 | 1.000