EIF4G1
[ENSRNOP00000049629]
Main page
| | | Plot |
Mito |
Lyso |
|
Perox |
ER |
Golgi |
PM |
Cytosol |
Nucleus |
|
| Expt A |
 41
41
peptides |
161
spectra |
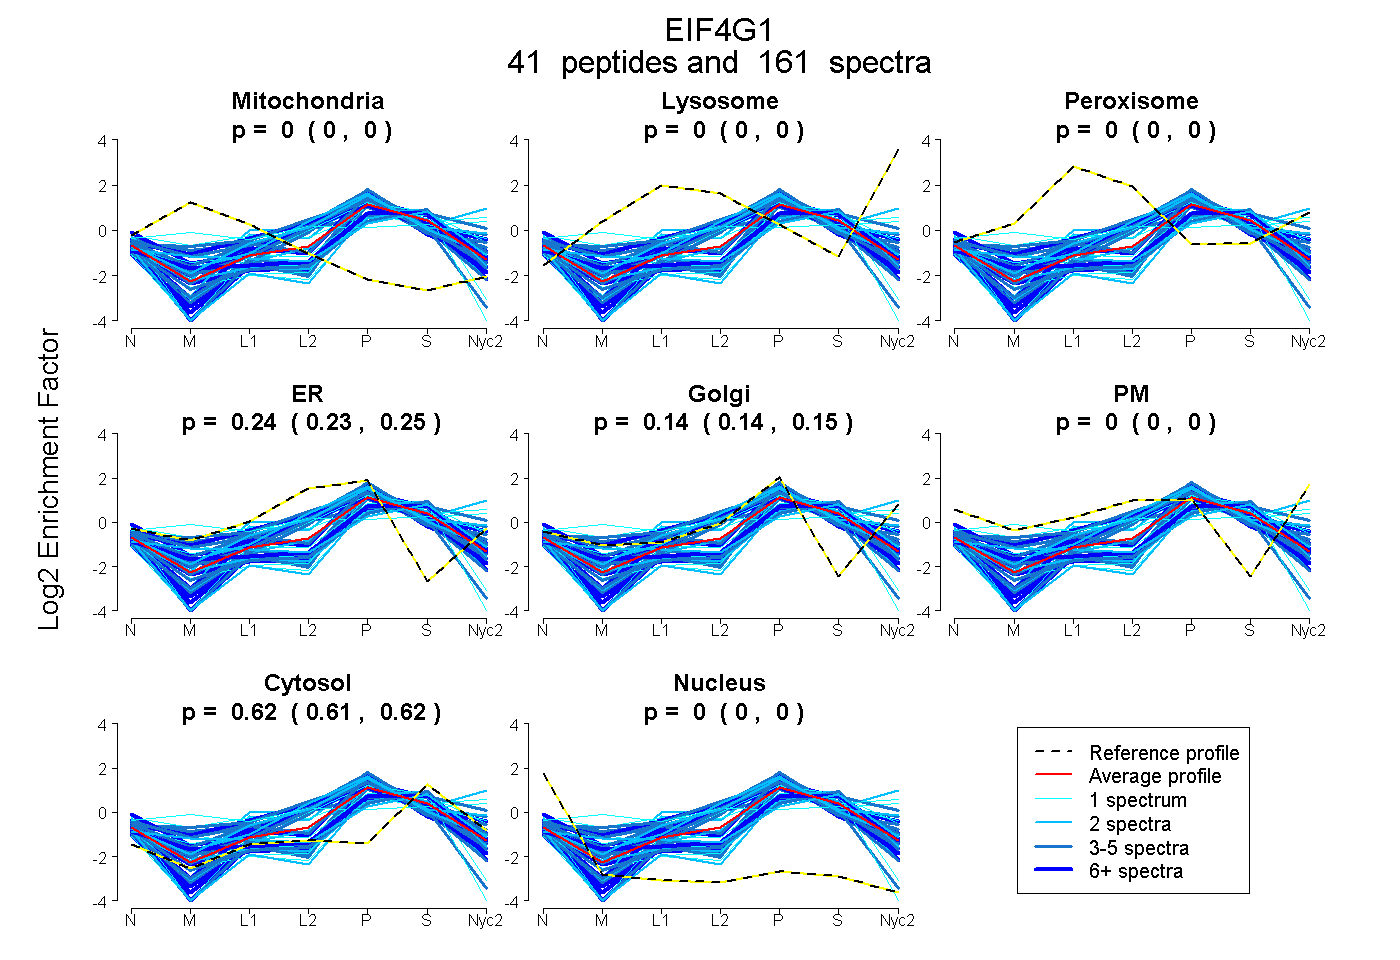 |
0.000
0.000 | 0.000 |
0.000
0.000 | 0.000 |
|
0.000
0.000 | 0.000 |
0.238
0.229 | 0.246 |
0.145
0.135 | 0.153 |
0.000
0.000 | 0.000 |
0.617
0.614 | 0.618 |
0.000
0.000 | 0.002 |
|
| | | Plot |
Mito |
|
Lyso or Perox |
|
ER |
Golgi |
PM |
Cytosol |
Nucleus |
|
| Expt B |
18
peptides |
52
spectra |
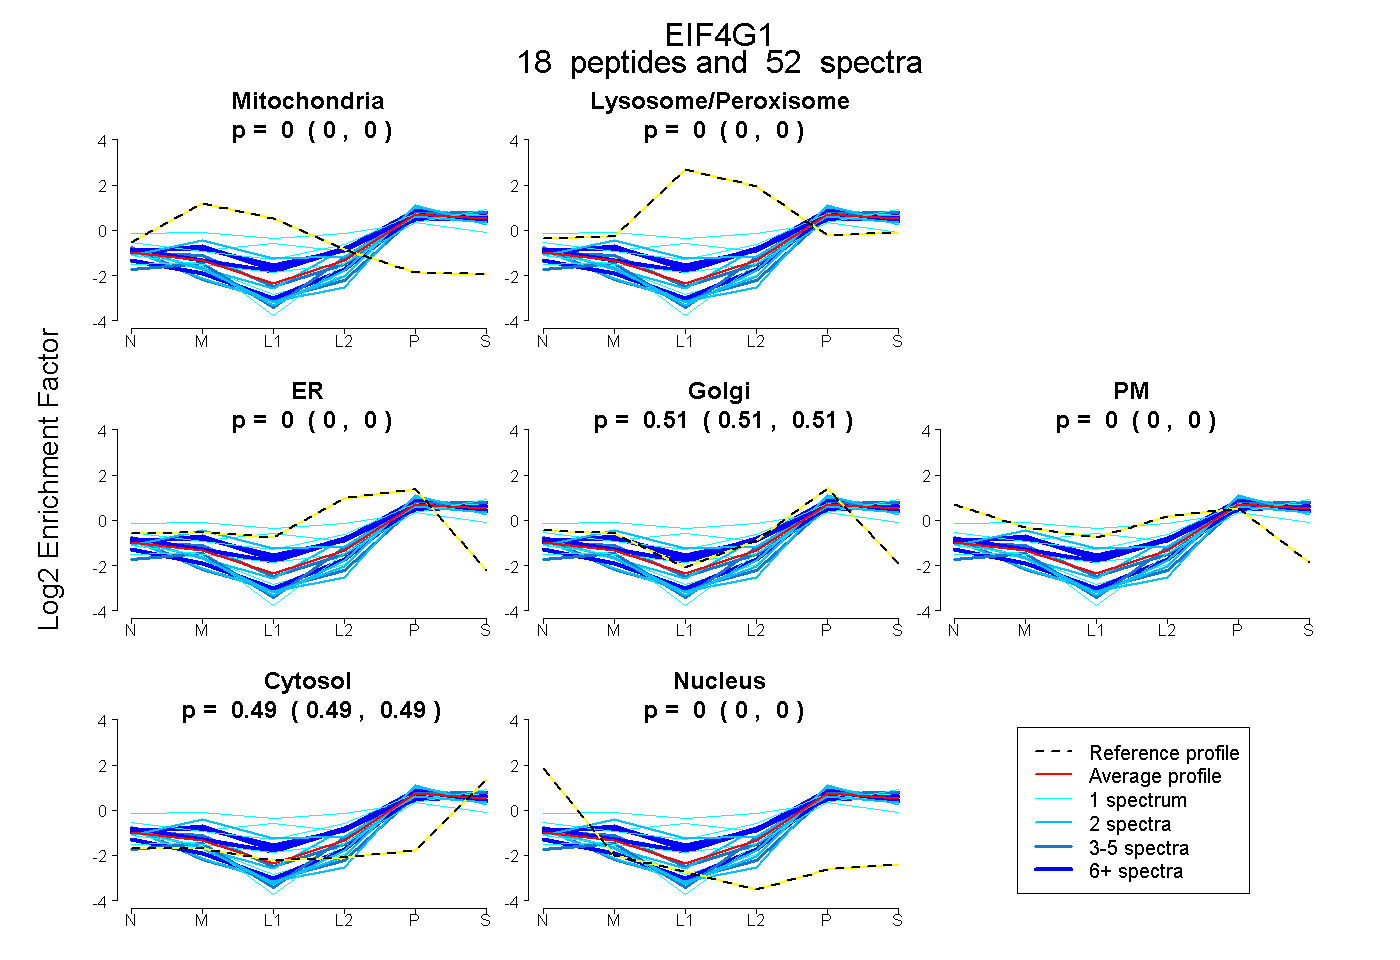 |
0.000
0.000 | 0.000 |
|
0.000
0.000 | 0.000 |
|
0.000
0.000 | 0.000 |
0.510
0.506 | 0.513 |
0.000
0.000 | 0.000 |
0.490
0.486 | 0.493 |
0.000
0.000 | 0.000 |
|
| 6 spectra, LGIESTLER |
0.000 |
|
0.135 |
|
0.000 |
0.427 |
0.000 |
0.439 |
0.000 |
|
| 3 spectra, AASLTEDR |
0.000 |
|
0.000 |
|
0.000 |
0.395 |
0.000 |
0.605 |
0.000 |
|
| 1 spectrum, SIGNIK |
0.000 |
|
0.202 |
|
0.000 |
0.472 |
0.000 |
0.326 |
0.000 |
|
| 7 spectra, EAVGDLLDAFK |
0.000 |
|
0.000 |
|
0.000 |
0.411 |
0.000 |
0.589 |
0.000 |
|
| 1 spectrum, VDVQVLK |
0.000 |
|
0.054 |
|
0.000 |
0.353 |
0.000 |
0.593 |
0.000 |
|
| 2 spectra, GGPGGELPR |
0.000 |
|
0.000 |
|
0.000 |
0.541 |
0.000 |
0.459 |
0.000 |
|
| 6 spectra, GVIDLIFEK |
0.000 |
|
0.142 |
|
0.000 |
0.474 |
0.000 |
0.384 |
0.000 |
|
| 1 spectrum, GGPPGPPVNR |
0.000 |
|
0.321 |
|
0.000 |
0.247 |
0.220 |
0.211 |
0.000 |
|
| 4 spectra, AALAVDEVER |
0.000 |
|
0.000 |
|
0.000 |
0.480 |
0.000 |
0.520 |
0.000 |
|
| 1 spectrum, APQPTGPPPAR |
0.000 |
|
0.000 |
|
0.000 |
0.418 |
0.000 |
0.582 |
0.000 |
|
| 2 spectra, GPAGLGPR |
0.000 |
|
0.000 |
|
0.000 |
0.549 |
0.000 |
0.451 |
0.000 |
|
| 2 spectra, TQDLFR |
0.000 |
|
0.166 |
|
0.000 |
0.446 |
0.000 |
0.388 |
0.000 |
|
| 6 spectra, FIGELFK |
0.000 |
|
0.095 |
|
0.000 |
0.512 |
0.000 |
0.393 |
0.000 |
|
| 1 spectrum, ERPSQPEGLR |
0.000 |
|
0.275 |
|
0.000 |
0.335 |
0.000 |
0.390 |
0.000 |
|
| 2 spectra, DLDFAK |
0.000 |
|
0.000 |
|
0.046 |
0.480 |
0.000 |
0.474 |
0.000 |
|
| 2 spectra, AQPPSSAASR |
0.000 |
|
0.000 |
|
0.000 |
0.445 |
0.000 |
0.555 |
0.000 |
|
| 1 spectrum, EMDEAATAEER |
0.000 |
|
0.000 |
|
0.000 |
0.470 |
0.000 |
0.530 |
0.000 |
|
| 4 spectra, FMLQDVIDLR |
0.000 |
|
0.000 |
|
0.000 |
0.437 |
0.000 |
0.563 |
0.000 |
|
| | | Plot |
|
Lyso |
|
|
|
|
|
|
|
Other |
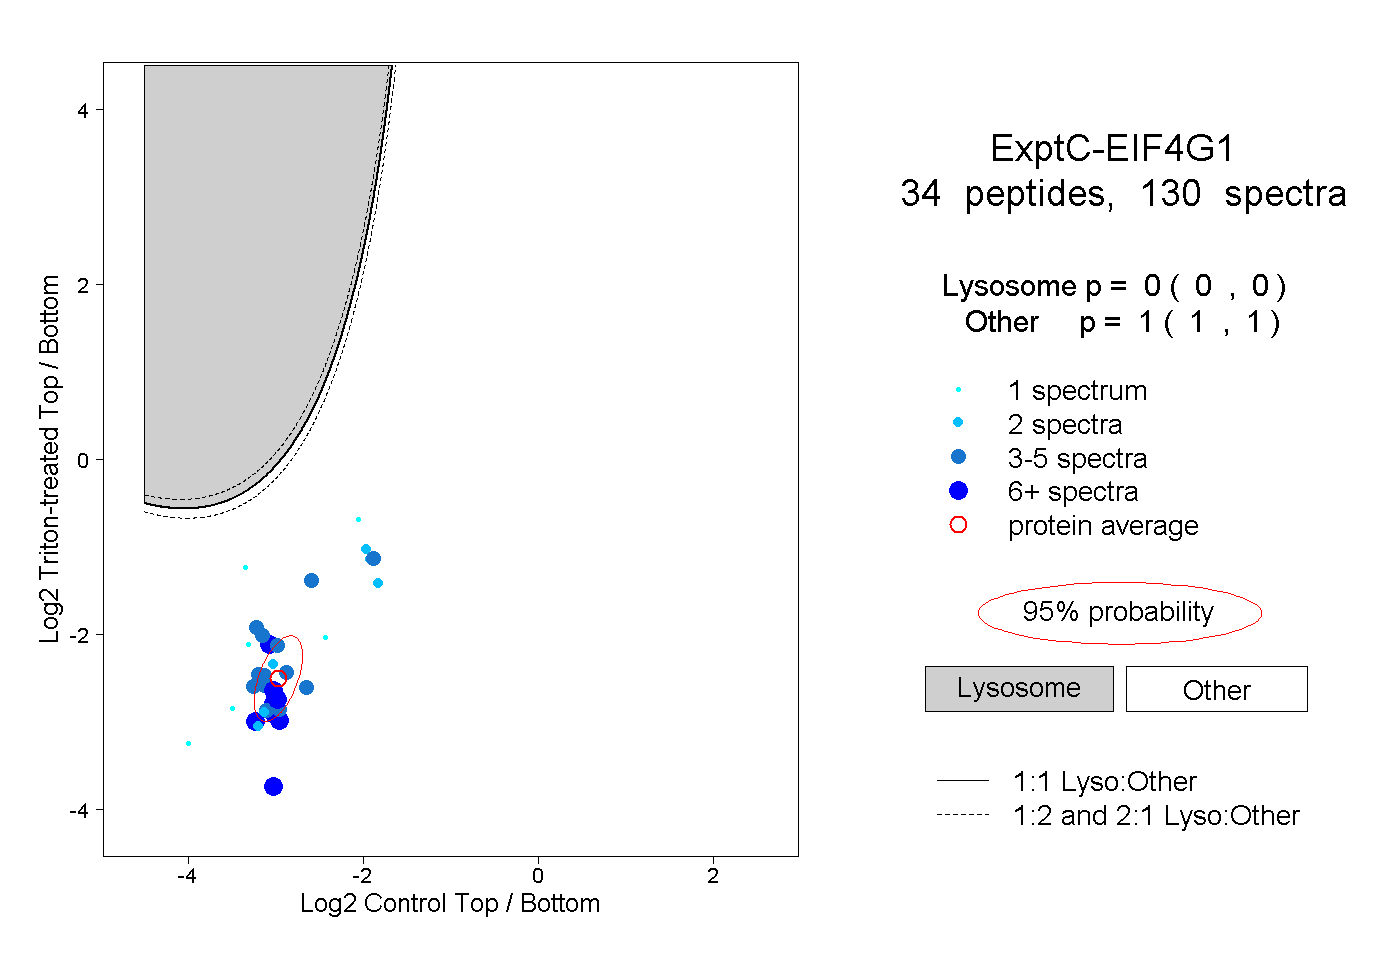
| Expt C |
34
peptides |
130
spectra |
 |
|
0.000
0.000 | 0.000 |
|
|
|
|
|
|
|
1.000
1.000 | 1.000 |
| | | Plot |
|
Lyso |
|
|
|
|
|
|
|
Other |
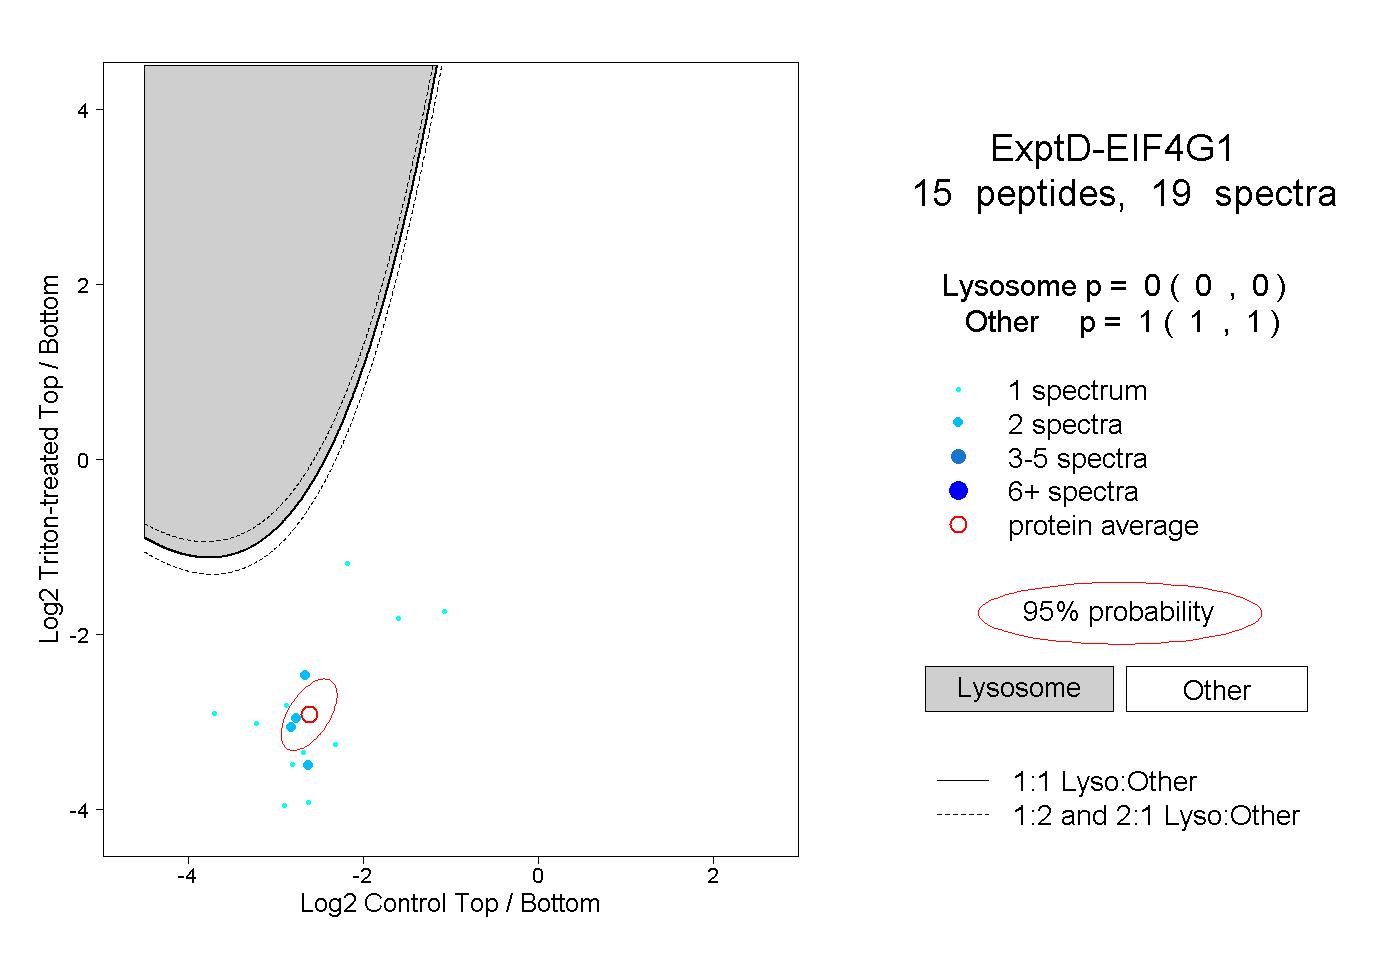
| Expt D |
15
peptides |
19
spectra |
 |
|
0.000
0.000 | 0.000 |
|
|
|
|
|
|
|
1.000
1.000 | 1.000 |