 9
9peptides
spectra
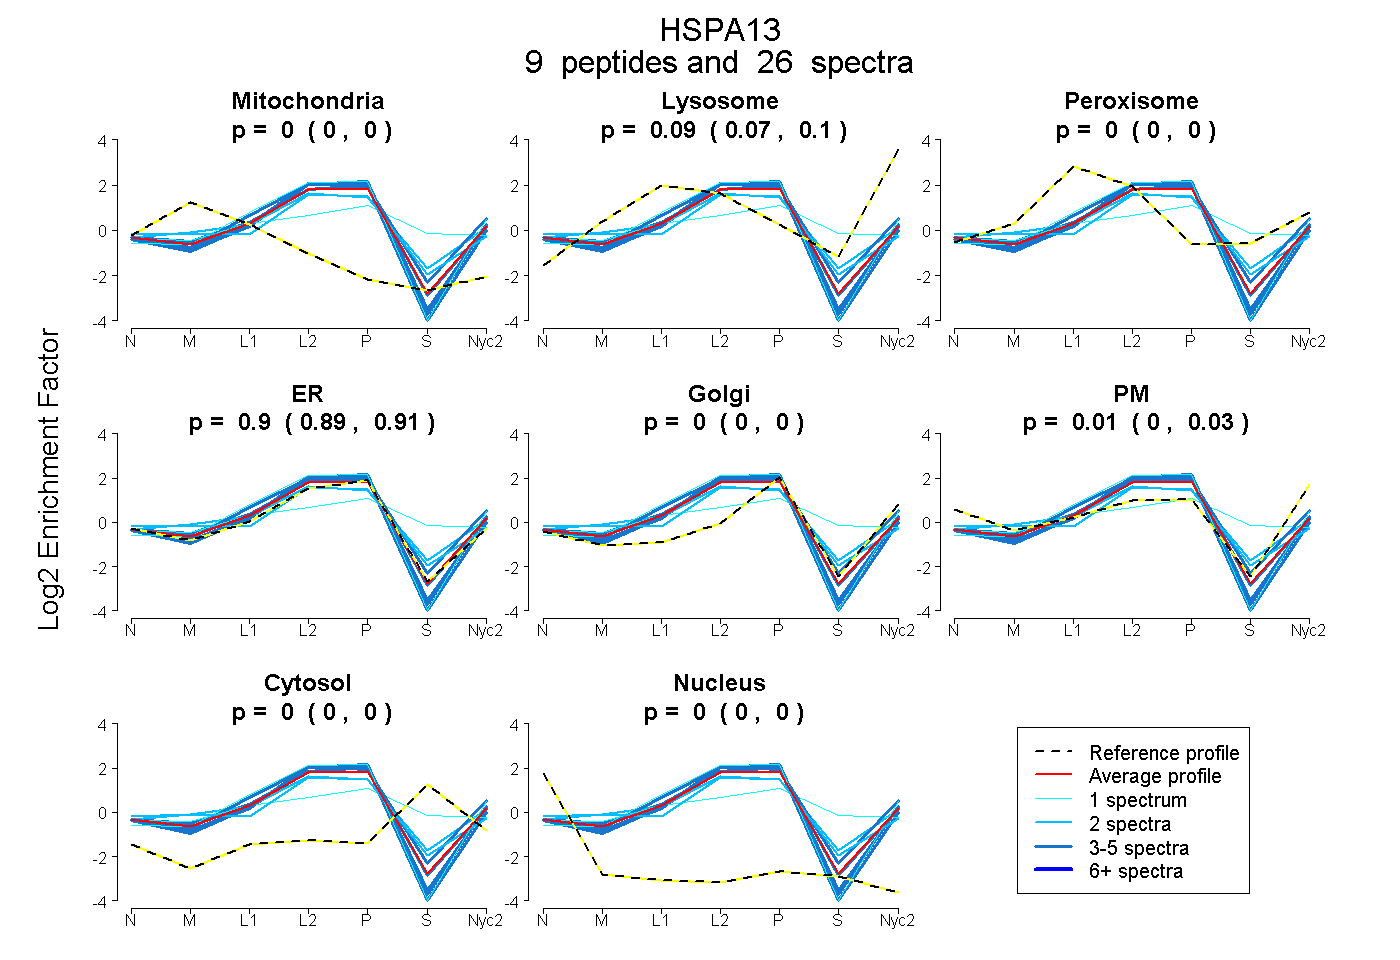
0.000 | 0.000
0.070 | 0.098
0.000 | 0.000
0.889 | 0.913
0.000 | 0.000
0.000 | 0.030
0.000 | 0.000
0.000 | 0.000
3peptides
spectra
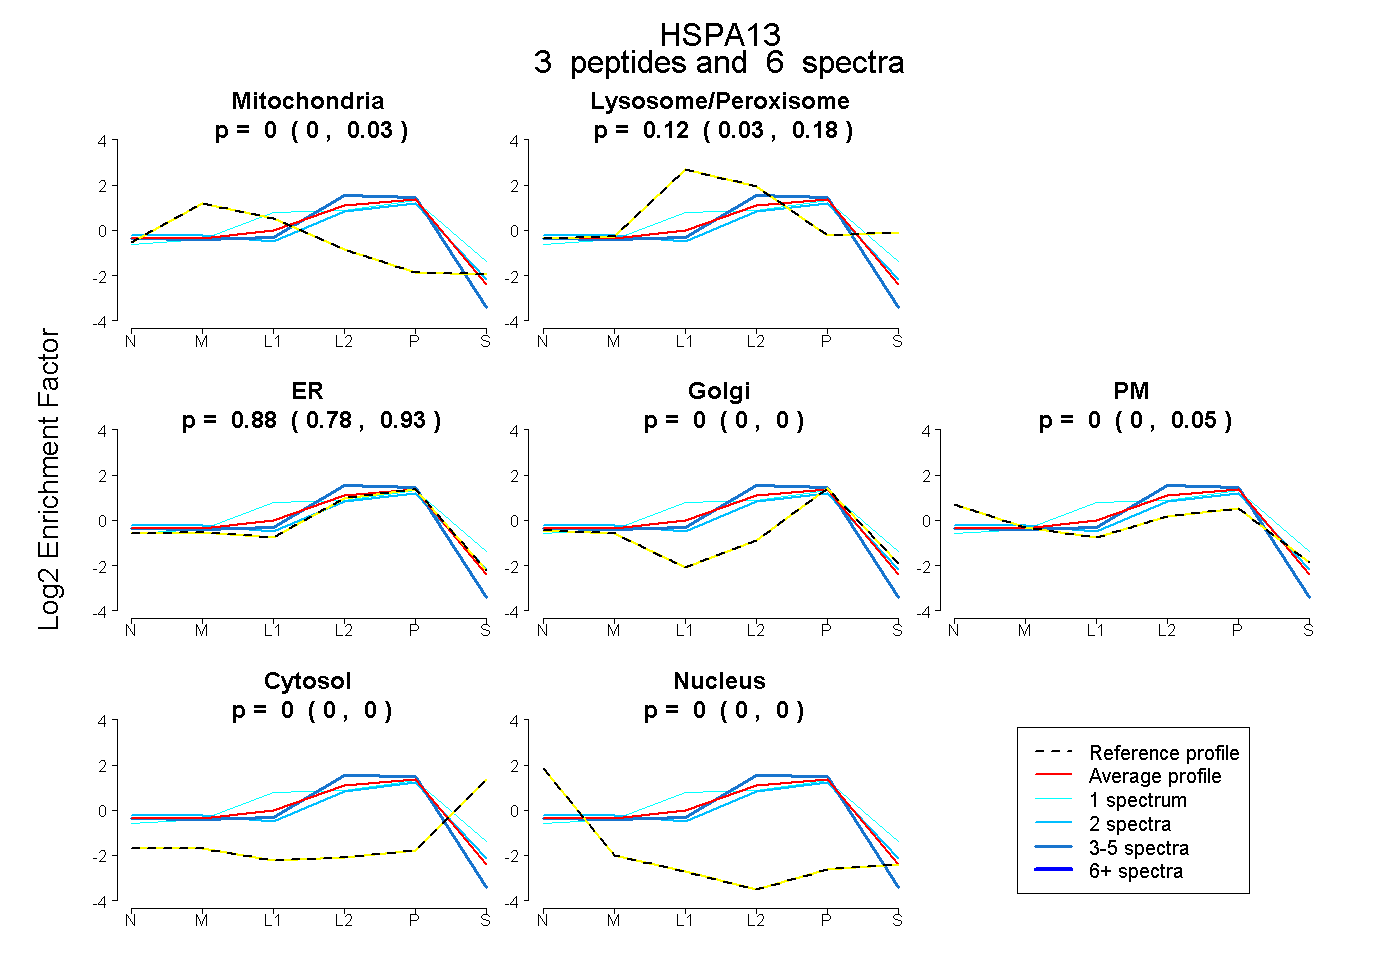
0.000 | 0.031
0.032 | 0.184
0.780 | 0.929
0.000 | 0.000
0.000 | 0.049
0.000 | 0.000
0.000 | 0.000
12peptides
spectra
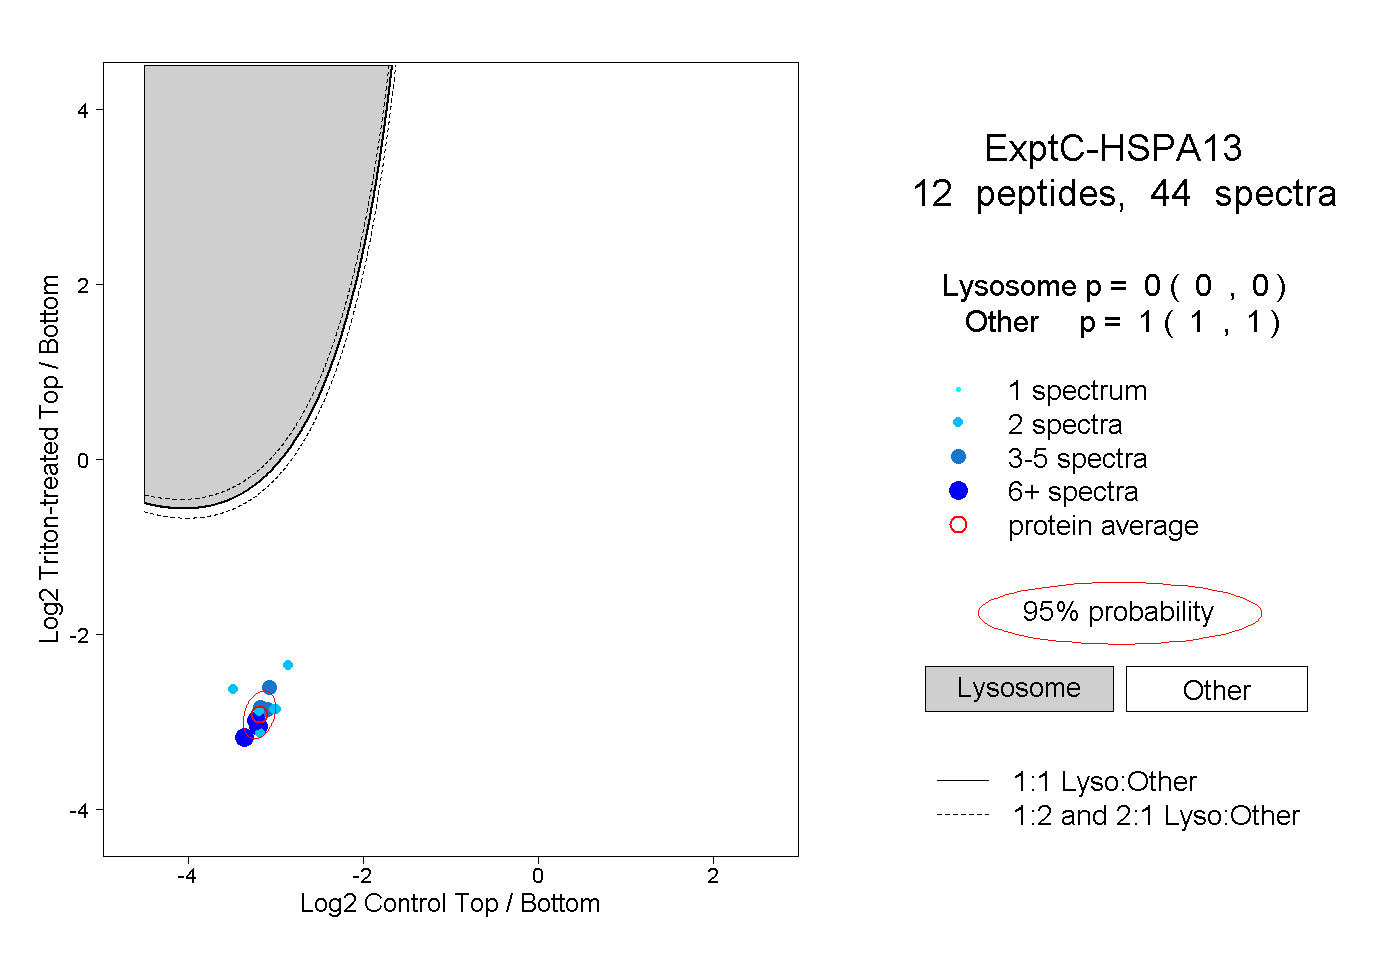
0.000 | 0.000
1.000 | 1.000
4peptides
spectra
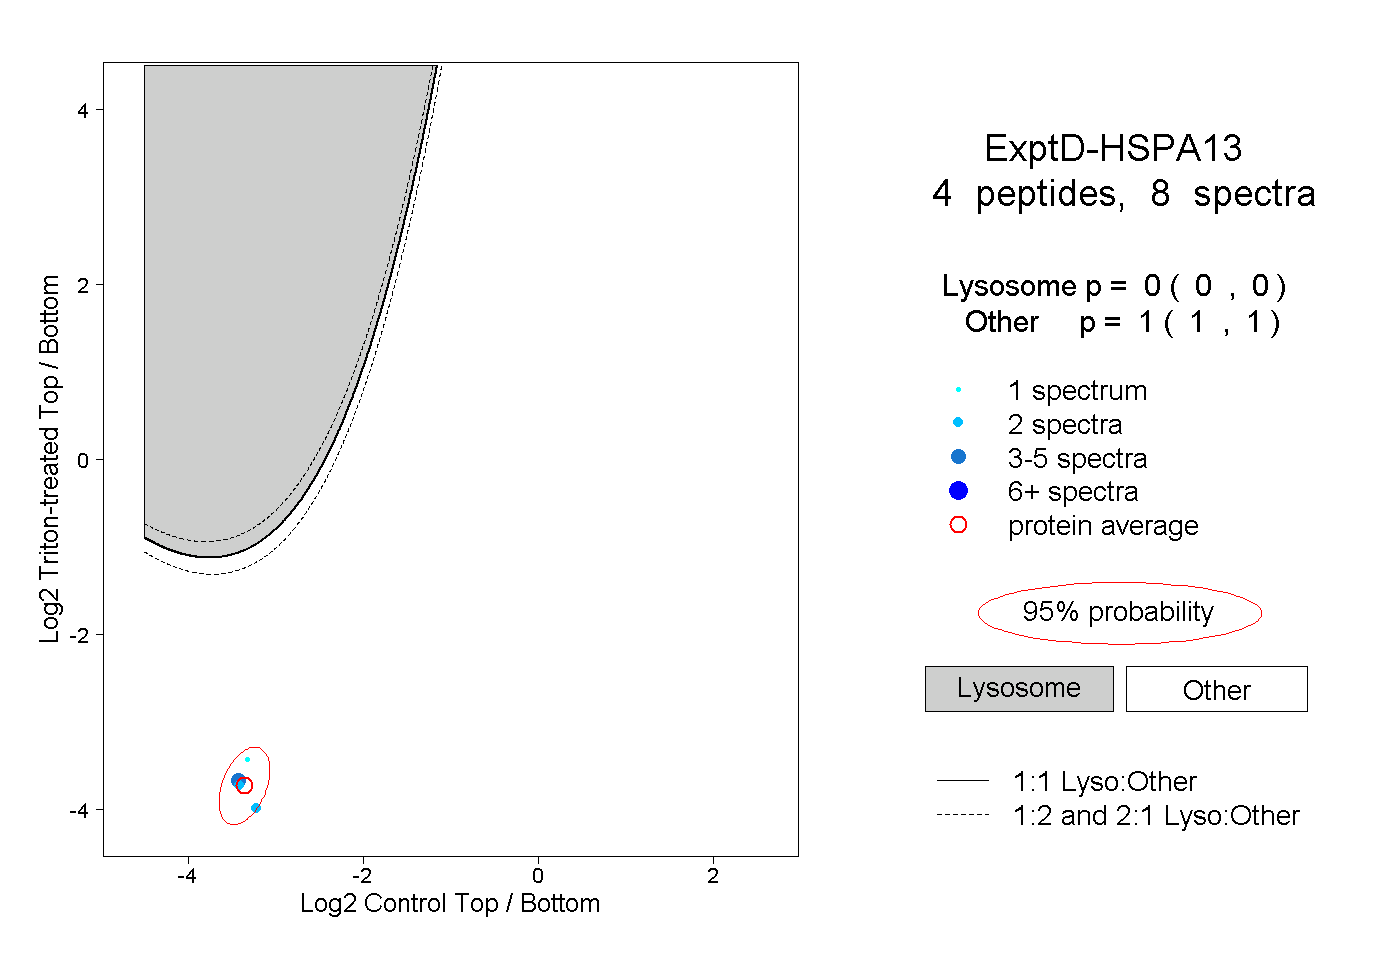
0.000 | 0.000
1.000 | 1.000