 9
9peptides
spectra
0.000 | 0.000
0.070 | 0.098
0.000 | 0.000
0.889 | 0.913
0.000 | 0.000
0.000 | 0.030
0.000 | 0.000
0.000 | 0.000
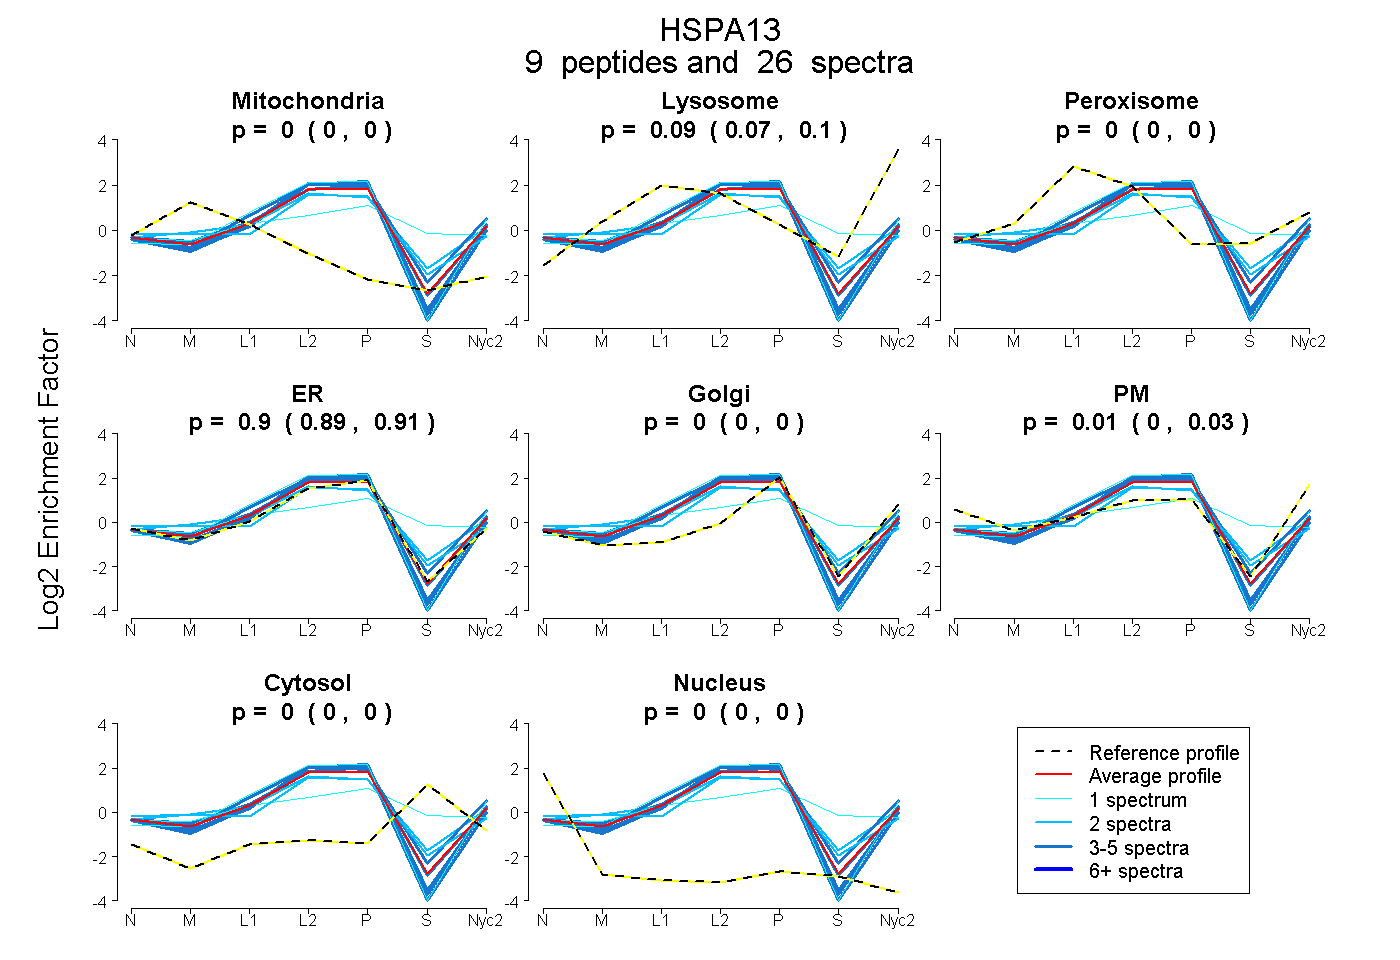
| Plot | Mito | Lyso | Perox | ER | Golgi | PM | Cytosol | Nucleus | |||||
| Expt A |
9 peptides |
26 spectra |
|
0.000 0.000 | 0.000 |
0.086 0.070 | 0.098 |
0.000 0.000 | 0.000 |
0.903 0.889 | 0.913 |
0.000 0.000 | 0.000 |
0.011 0.000 | 0.030 |
0.000 0.000 | 0.000 |
0.000 0.000 | 0.000 |
| 1 spectrum, QVIQEFFGK | 0.000 | 0.095 | 0.000 | 0.905 | 0.000 | 0.000 | 0.000 | 0.000 | ||
| 4 spectra, LLQYLYK | 0.000 | 0.092 | 0.006 | 0.901 | 0.000 | 0.000 | 0.000 | 0.000 | ||
| 2 spectra, VFRPGLSDSTSGK | 0.051 | 0.000 | 0.076 | 0.807 | 0.000 | 0.033 | 0.033 | 0.000 | ||
| 5 spectra, AMSGNNK | 0.000 | 0.000 | 0.000 | 0.958 | 0.000 | 0.042 | 0.000 | 0.000 | ||
| 2 spectra, LGGQDFNQR | 0.000 | 0.055 | 0.172 | 0.700 | 0.020 | 0.025 | 0.028 | 0.000 | ||
| 4 spectra, QGGMFLTR | 0.000 | 0.151 | 0.000 | 0.849 | 0.000 | 0.000 | 0.000 | 0.000 | ||
| 3 spectra, ILVPIQQVLK | 0.000 | 0.000 | 0.000 | 0.967 | 0.000 | 0.033 | 0.000 | 0.000 | ||
| 4 spectra, IFTPEELEAEIGR | 0.000 | 0.000 | 0.000 | 0.946 | 0.000 | 0.054 | 0.000 | 0.000 | ||
| 1 spectrum, LPEDQLTPGDGHHVNR | 0.000 | 0.000 | 0.289 | 0.325 | 0.126 | 0.000 | 0.260 | 0.000 |
| Plot | Mito | Lyso or Perox | ER | Golgi | PM | Cytosol | Nucleus | ||||||
| Expt B |
3 peptides |
6 spectra |
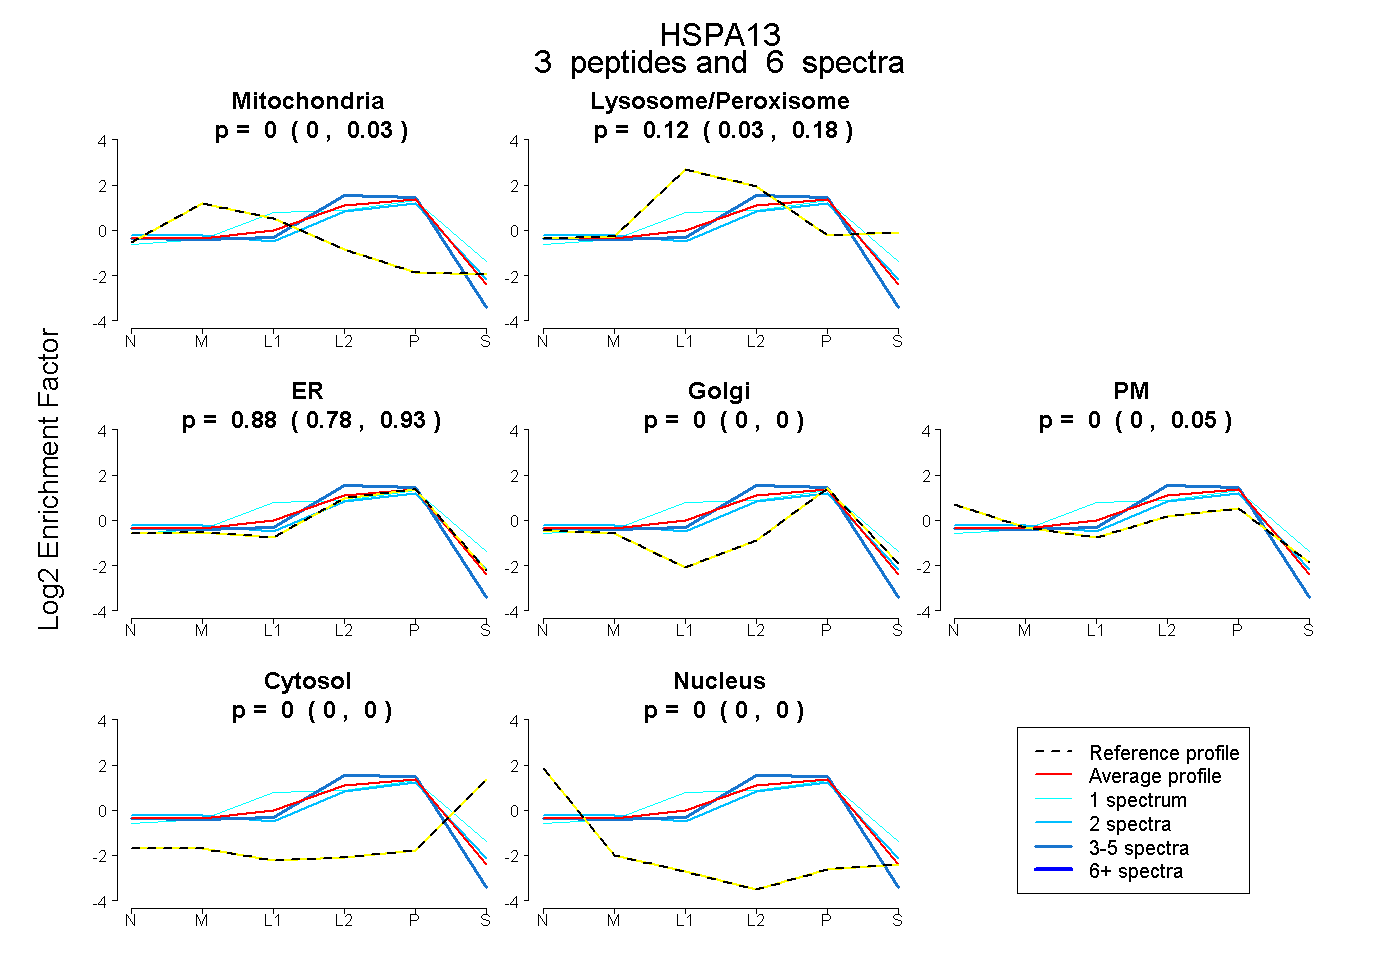 |
0.000 0.000 | 0.031 |
0.122 0.032 | 0.184 |
0.878 0.780 | 0.929 |
0.000 0.000 | 0.000 |
0.000 0.000 | 0.049 |
0.000 0.000 | 0.000 |
0.000 0.000 | 0.000 |
|||
| Plot | Lyso | Other | |||||||||||
| Expt C |
12 peptides |
44 spectra |
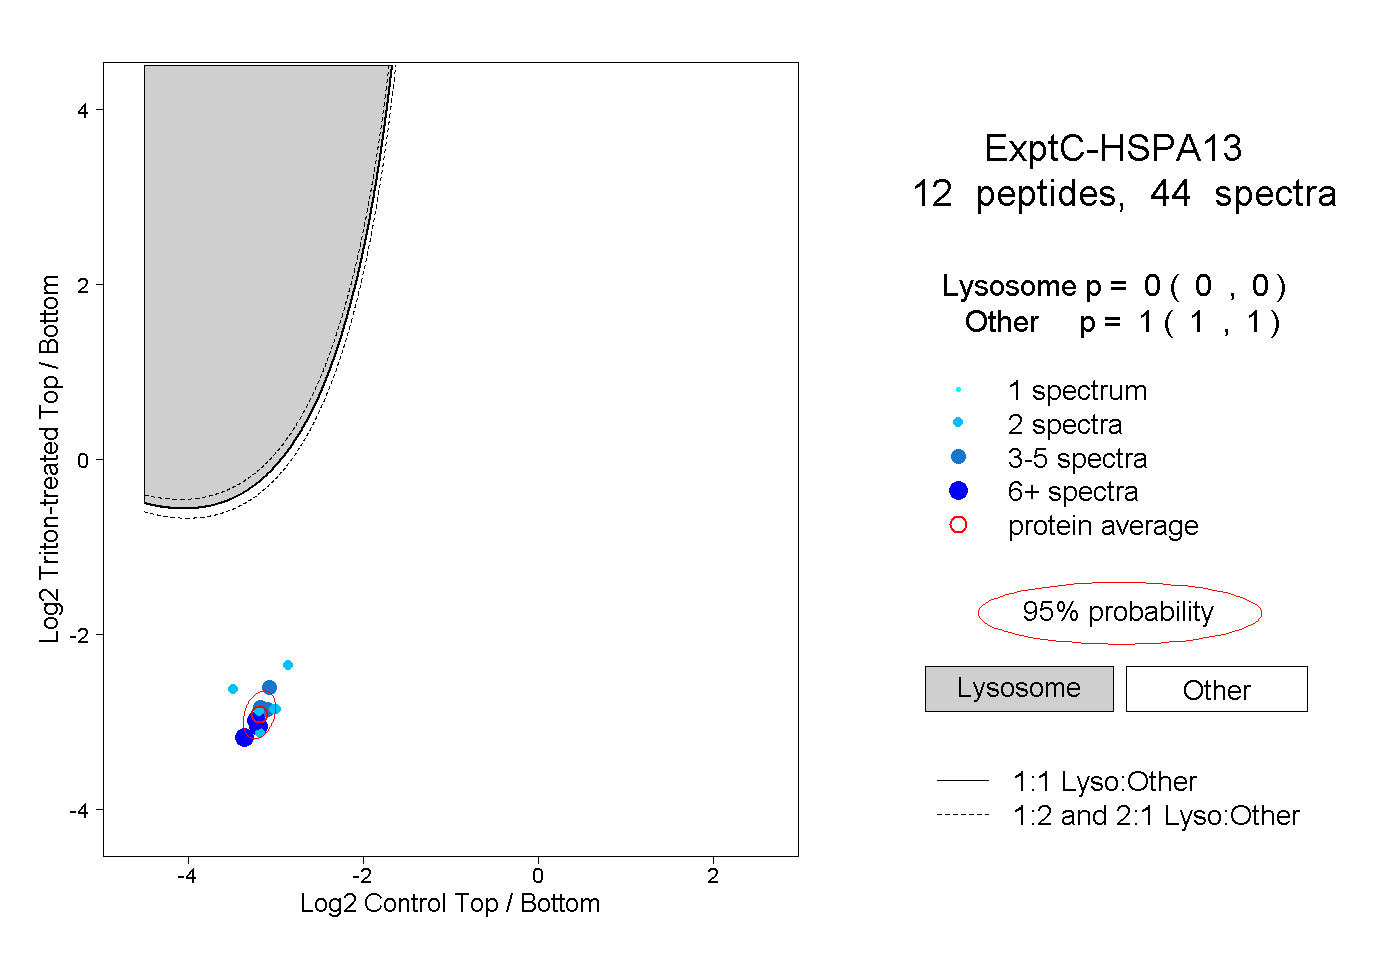 |
0.000 0.000 | 0.000 |
1.000 1.000 | 1.000 |
||||||||
| Plot | Lyso | Other | |||||||||||
| Expt D |
4 peptides |
8 spectra |
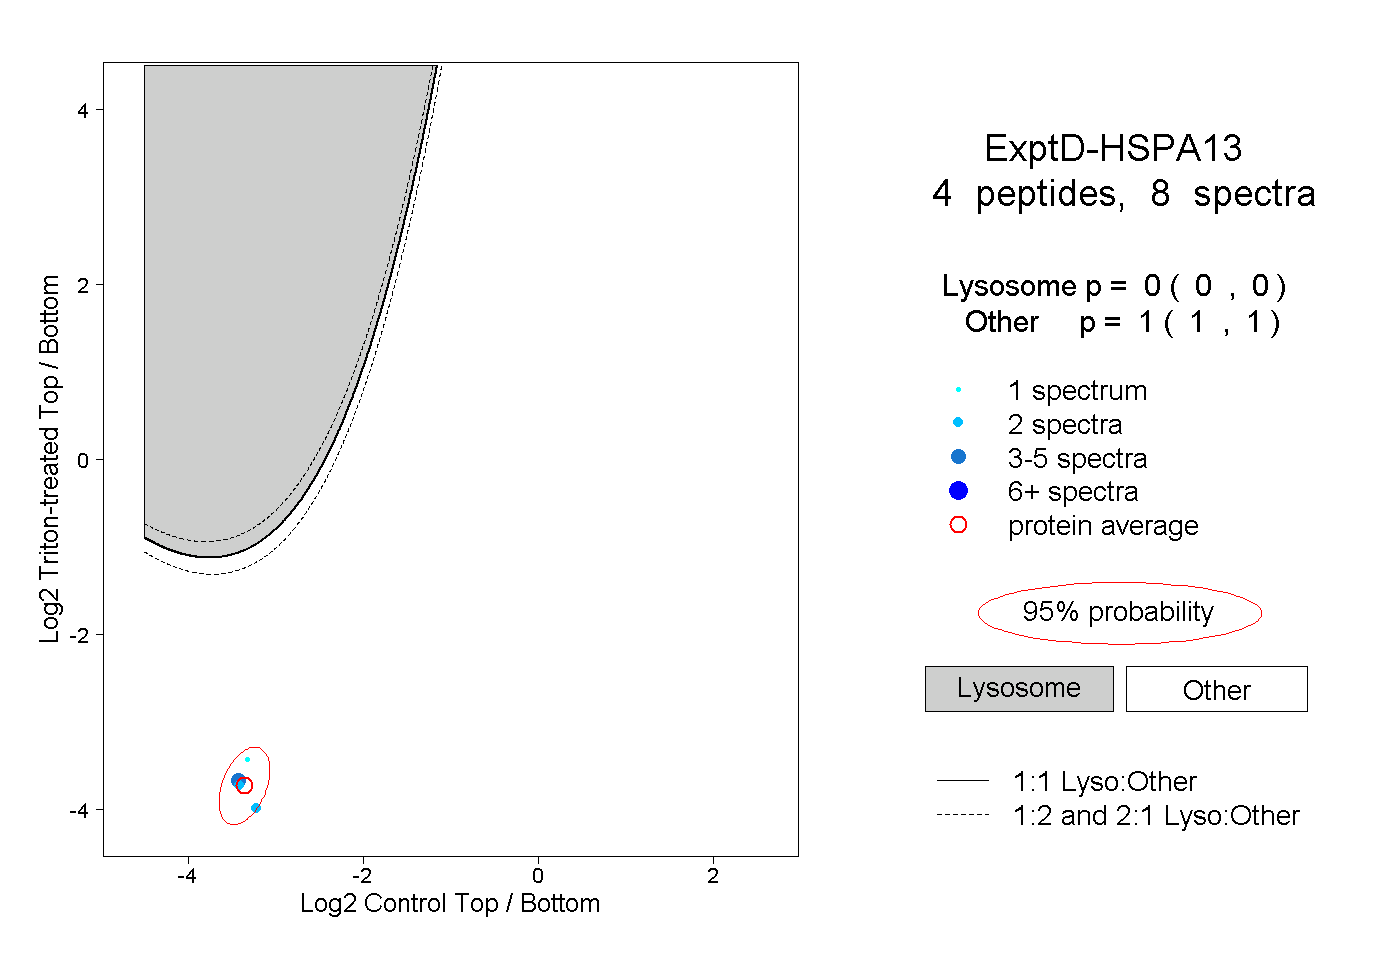 |
0.000 0.000 | 0.000 |
1.000 1.000 | 1.000 |