 17
17peptides
spectra
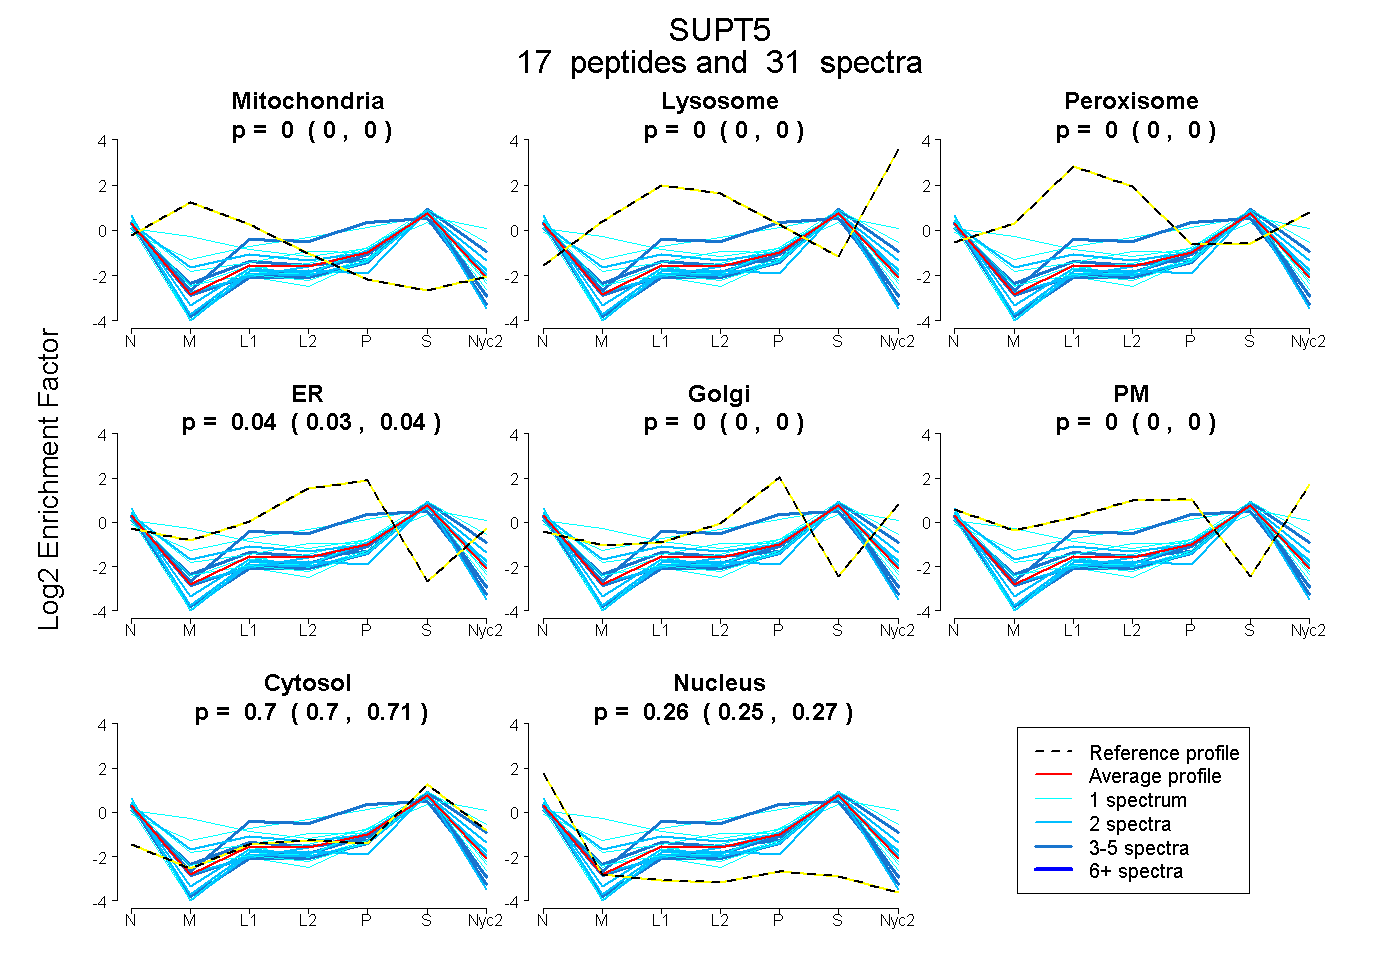
0.000 | 0.000
0.000 | 0.000
0.000 | 0.000
0.030 | 0.043
0.000 | 0.000
0.000 | 0.000
0.698 | 0.709
0.253 | 0.265
2peptides
spectra
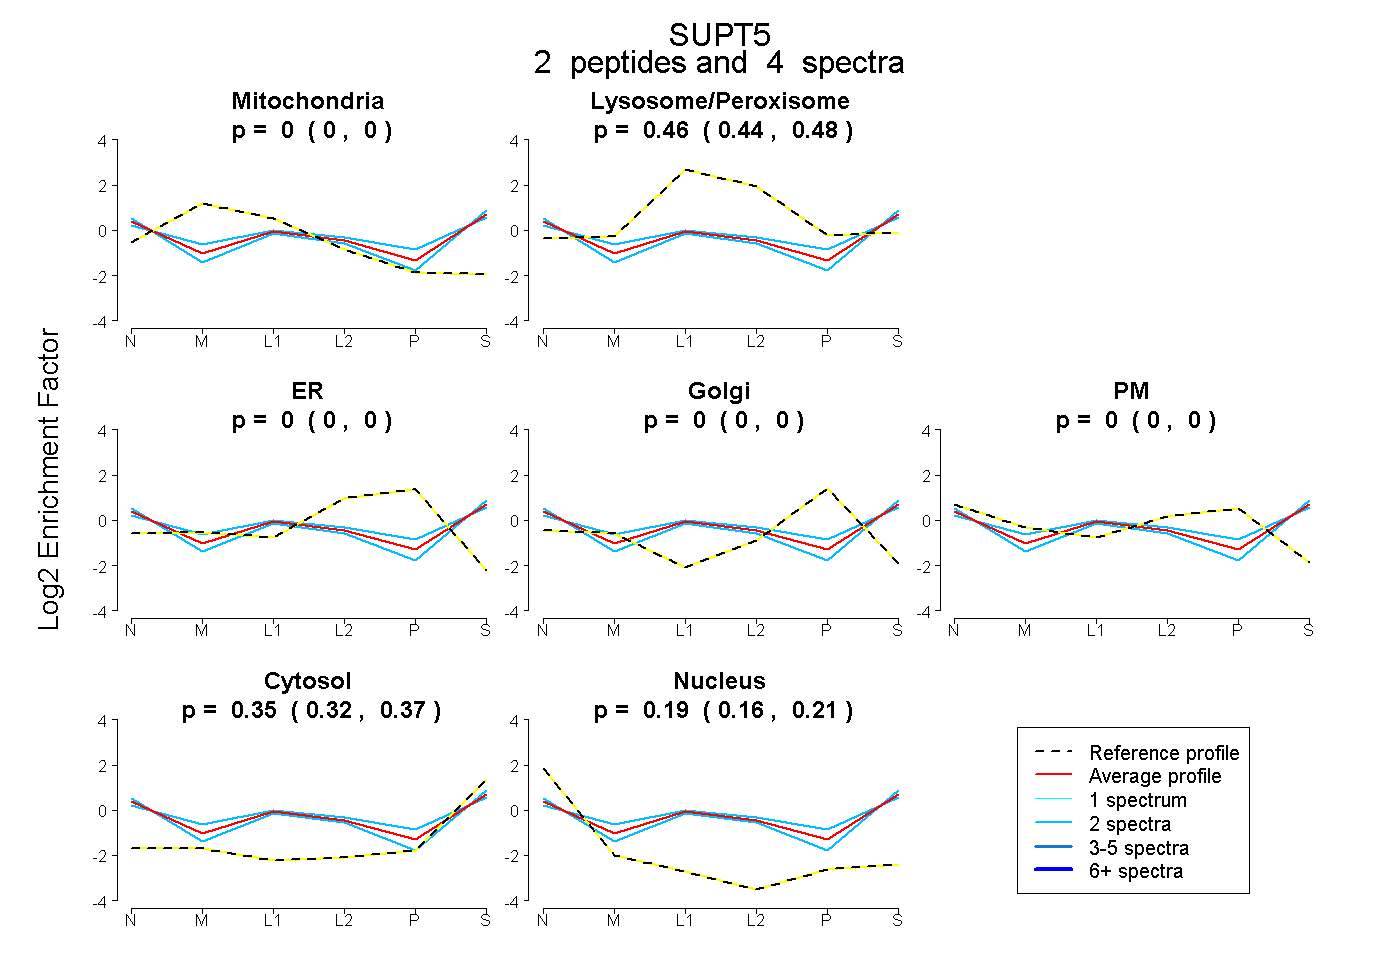
0.000 | 0.000
0.442 | 0.476
0.000 | 0.000
0.000 | 0.000
0.000 | 0.000
0.324 | 0.373
0.163 | 0.206
8peptides
spectra
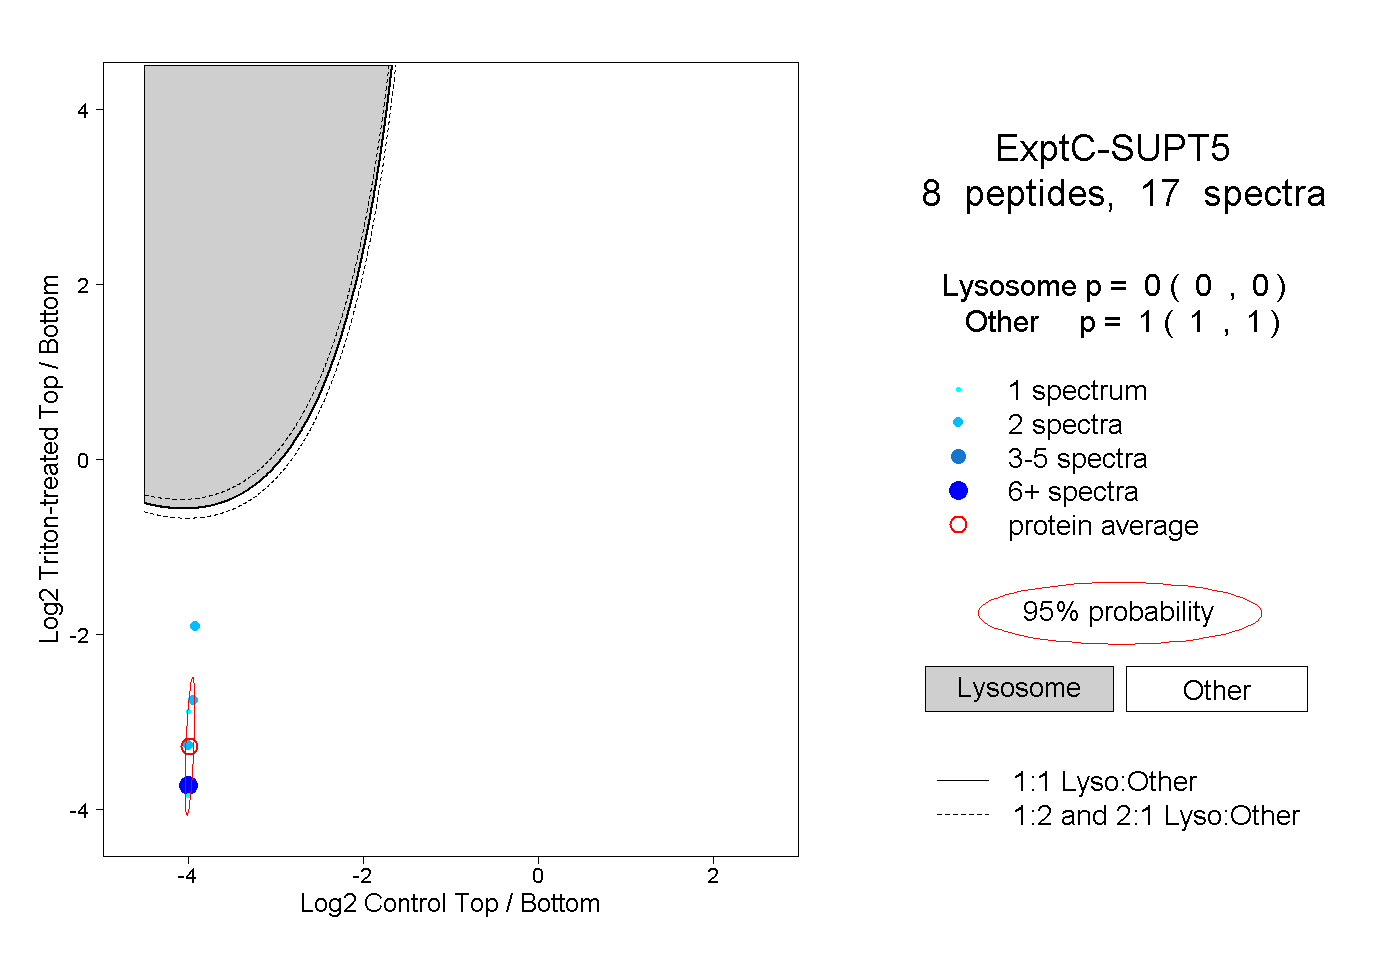
0.000 | 0.000
1.000 | 1.000
2peptides
spectra
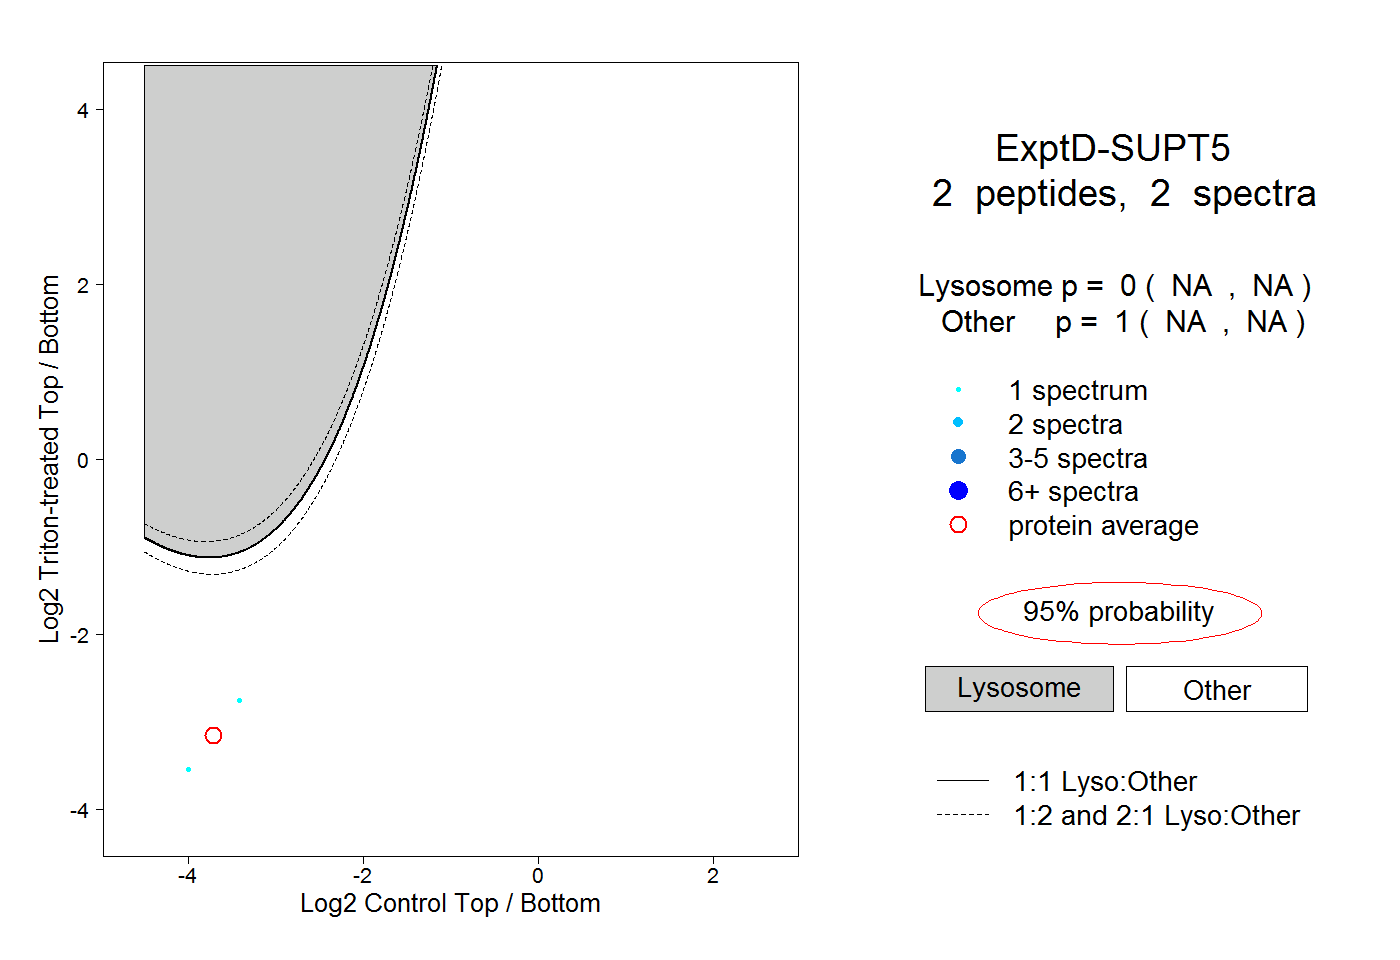
NA | NA
NA | NA