 17
17peptides
spectra
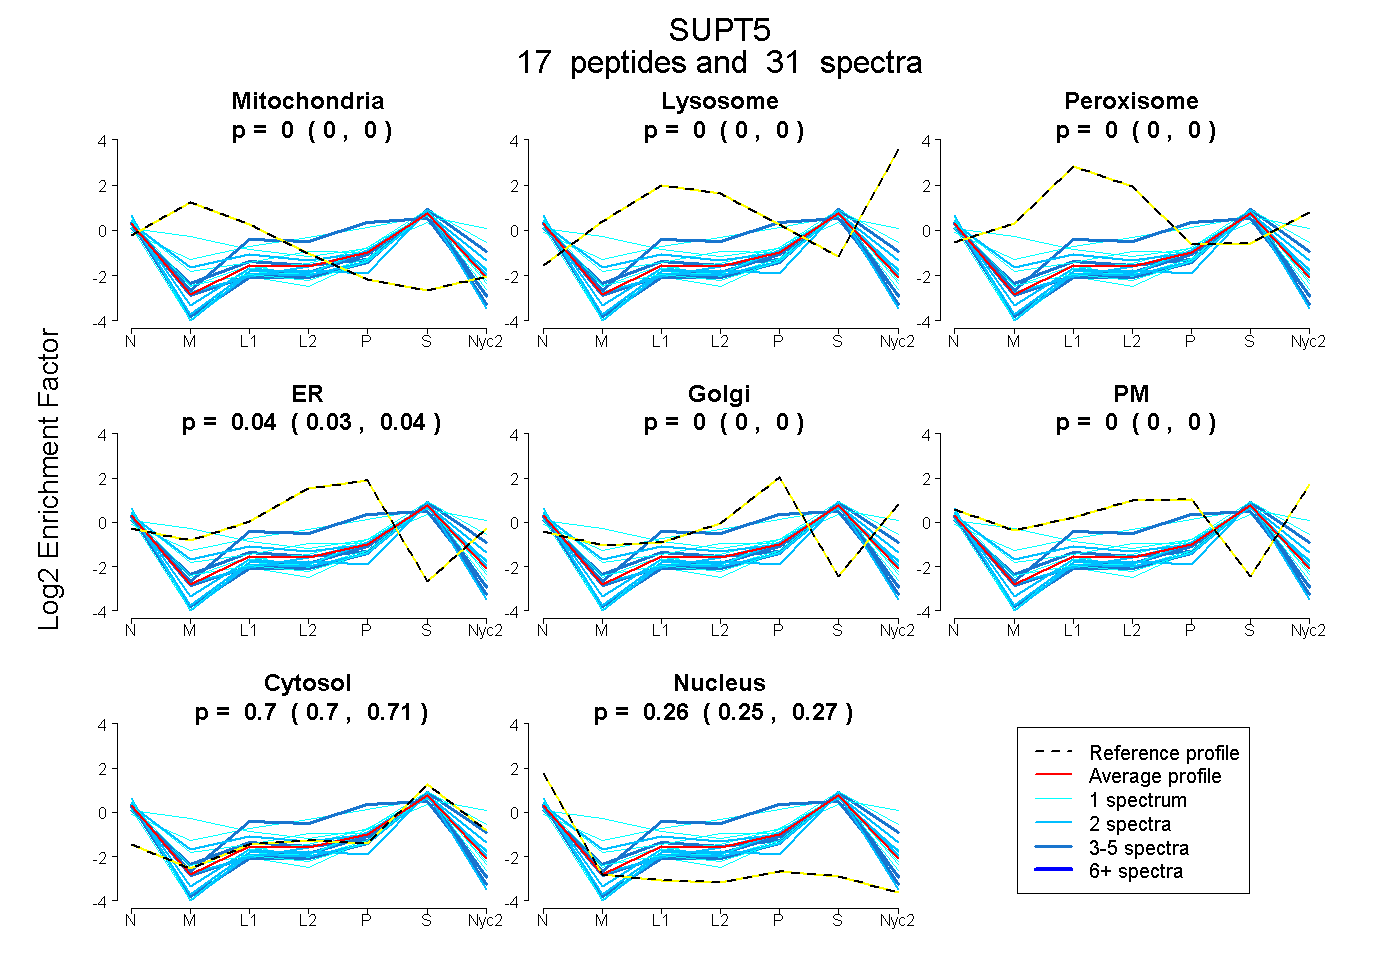
0.000 | 0.000
0.000 | 0.000
0.000 | 0.000
0.030 | 0.043
0.000 | 0.000
0.000 | 0.000
0.698 | 0.709
0.253 | 0.265
| Plot | Mito | Lyso | Perox | ER | Golgi | PM | Cytosol | Nucleus | |||||
| Expt A |
17 peptides |
31 spectra |
|
0.000 0.000 | 0.000 |
0.000 0.000 | 0.000 |
0.000 0.000 | 0.000 |
0.037 0.030 | 0.043 |
0.000 0.000 | 0.000 |
0.000 0.000 | 0.000 |
0.704 0.698 | 0.709 |
0.260 0.253 | 0.265 |
| 1 spectrum, GYIGVVK | 0.000 | 0.000 | 0.004 | 0.000 | 0.000 | 0.000 | 0.729 | 0.267 | ||
| 4 spectra, HLVLAGGSKPR | 0.000 | 0.000 | 0.000 | 0.000 | 0.000 | 0.000 | 0.631 | 0.369 | ||
| 3 spectra, ATAISLMR | 0.000 | 0.000 | 0.016 | 0.000 | 0.000 | 0.069 | 0.763 | 0.152 | ||
| 1 spectrum, MGDHVK | 0.000 | 0.000 | 0.099 | 0.066 | 0.000 | 0.000 | 0.613 | 0.222 | ||
| 2 spectra, VILGEDR | 0.000 | 0.000 | 0.000 | 0.000 | 0.000 | 0.000 | 0.595 | 0.405 | ||
| 3 spectra, SVVAPEHVK | 0.000 | 0.000 | 0.000 | 0.295 | 0.000 | 0.000 | 0.538 | 0.166 | ||
| 2 spectra, QAIEGVGNLR | 0.000 | 0.000 | 0.000 | 0.025 | 0.000 | 0.000 | 0.701 | 0.274 | ||
| 1 spectrum, ITIMPK | 0.000 | 0.000 | 0.000 | 0.000 | 0.038 | 0.000 | 0.806 | 0.156 | ||
| 1 spectrum, DATESTAR | 0.000 | 0.000 | 0.000 | 0.000 | 0.000 | 0.000 | 0.647 | 0.353 | ||
| 3 spectra, FEGDTGLIVR | 0.000 | 0.000 | 0.000 | 0.000 | 0.000 | 0.000 | 0.631 | 0.369 | ||
| 1 spectrum, LGYWNQQMVPIK | 0.000 | 0.000 | 0.046 | 0.000 | 0.000 | 0.366 | 0.588 | 0.000 | ||
| 2 spectra, LQNLWR | 0.000 | 0.000 | 0.000 | 0.000 | 0.000 | 0.000 | 0.660 | 0.340 | ||
| 1 spectrum, VLSVDGNK | 0.000 | 0.000 | 0.000 | 0.000 | 0.000 | 0.000 | 0.648 | 0.352 | ||
| 2 spectra, ISQGPYK | 0.000 | 0.000 | 0.000 | 0.000 | 0.031 | 0.000 | 0.726 | 0.243 | ||
| 1 spectrum, DPNLWTVK | 0.372 | 0.000 | 0.000 | 0.071 | 0.000 | 0.005 | 0.540 | 0.013 | ||
| 1 spectrum, SLGGDVASDGDFLIFEGNR | 0.000 | 0.000 | 0.000 | 0.013 | 0.000 | 0.000 | 0.694 | 0.293 | ||
| 2 spectra, VIDGPHSGR | 0.000 | 0.000 | 0.171 | 0.000 | 0.000 | 0.000 | 0.577 | 0.252 |
| Plot | Mito | Lyso or Perox | ER | Golgi | PM | Cytosol | Nucleus | ||||||
| Expt B |
2 peptides |
4 spectra |
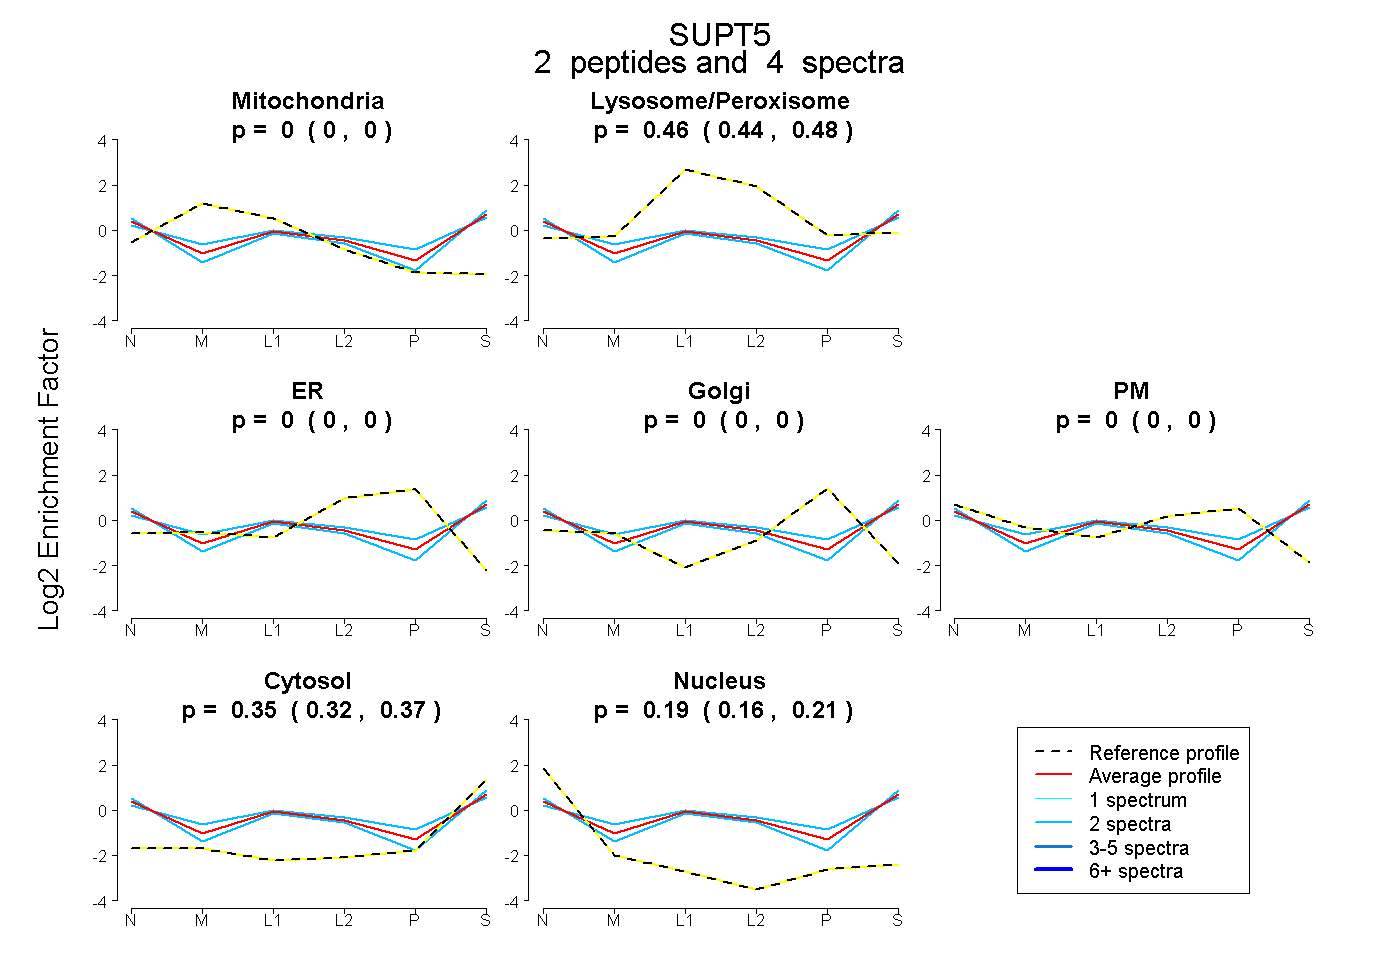 |
0.000 0.000 | 0.000 |
0.461 0.442 | 0.476 |
0.000 0.000 | 0.000 |
0.000 0.000 | 0.000 |
0.000 0.000 | 0.000 |
0.350 0.324 | 0.373 |
0.188 0.163 | 0.206 |
|||
| Plot | Lyso | Other | |||||||||||
| Expt C |
8 peptides |
17 spectra |
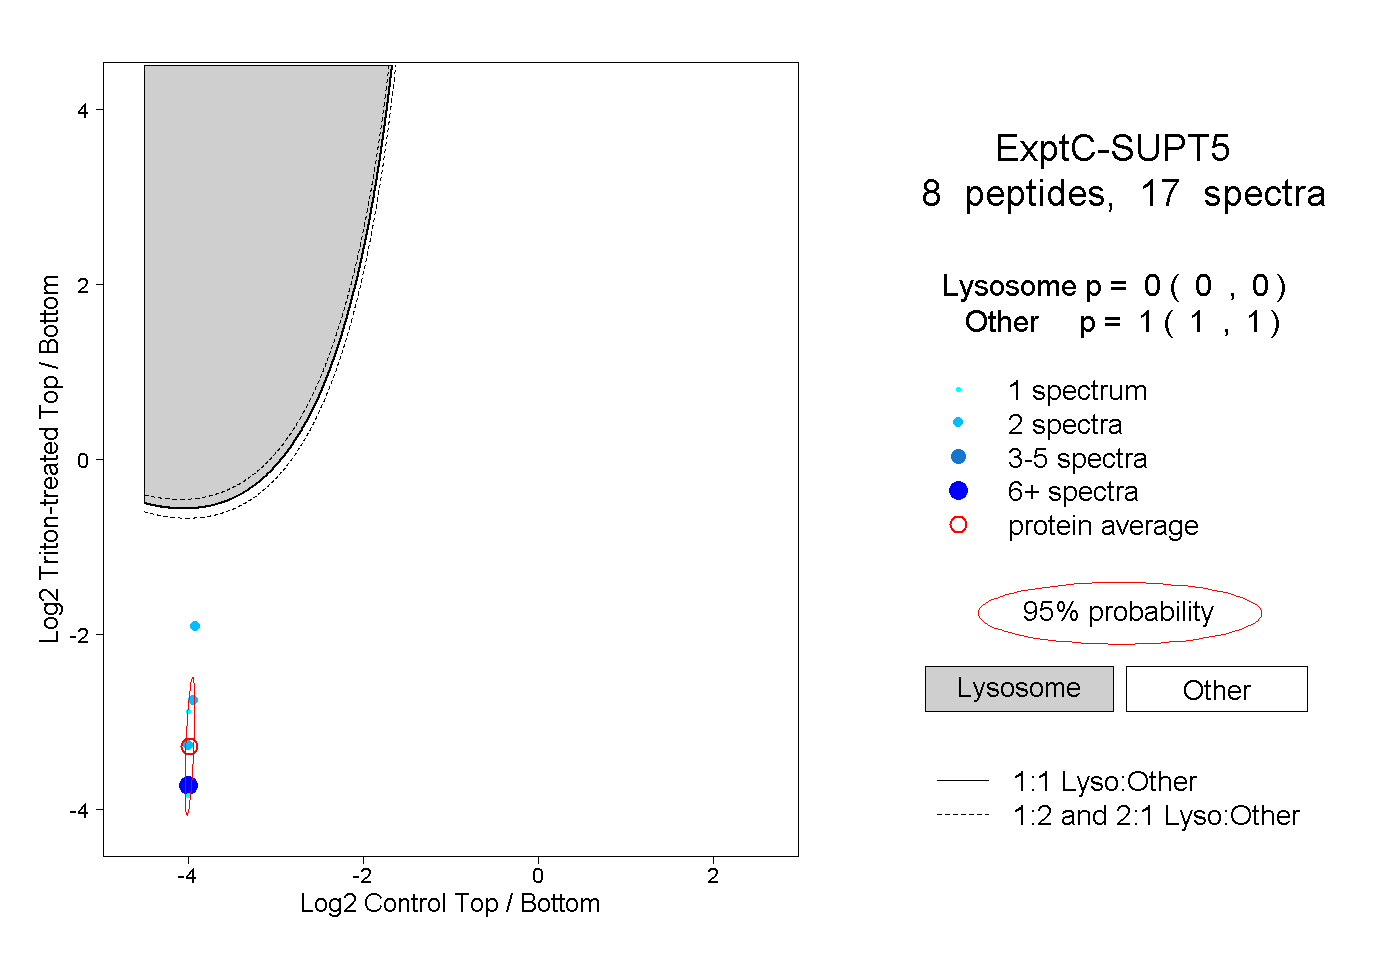 |
0.000 0.000 | 0.000 |
1.000 1.000 | 1.000 |
||||||||
| Plot | Lyso | Other | |||||||||||
| Expt D |
2 peptides |
2 spectra |
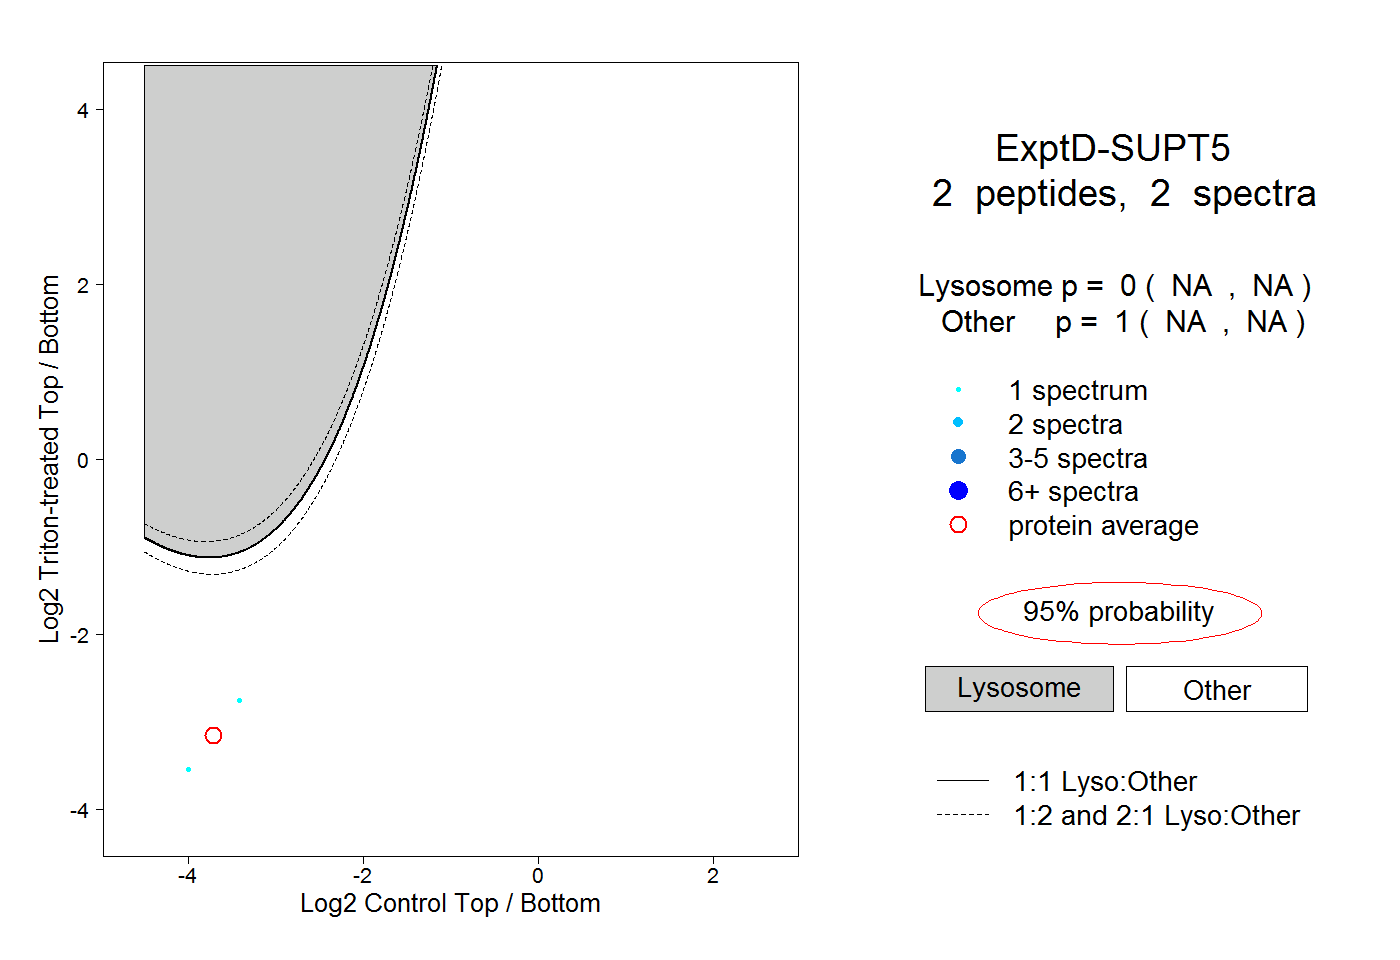 |
0.000 NA | NA |
1.000 NA | NA |