 3
3peptides
spectra
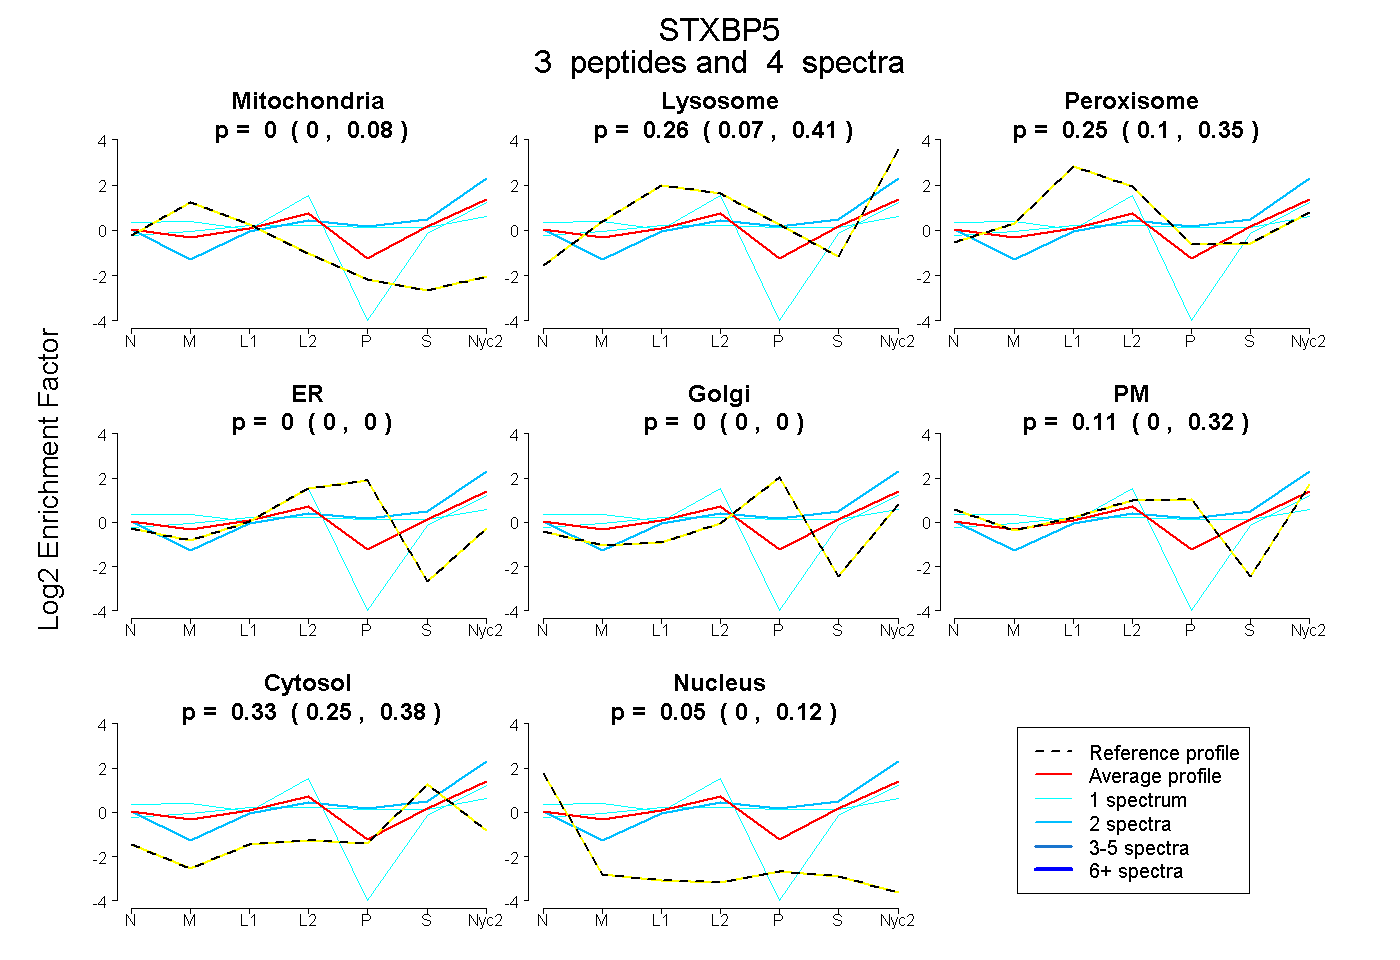
0.000 | 0.080
0.070 | 0.412
0.097 | 0.353
0.000 | 0.000
0.000 | 0.000
0.000 | 0.321
0.252 | 0.376
0.000 | 0.122
2peptides
spectra
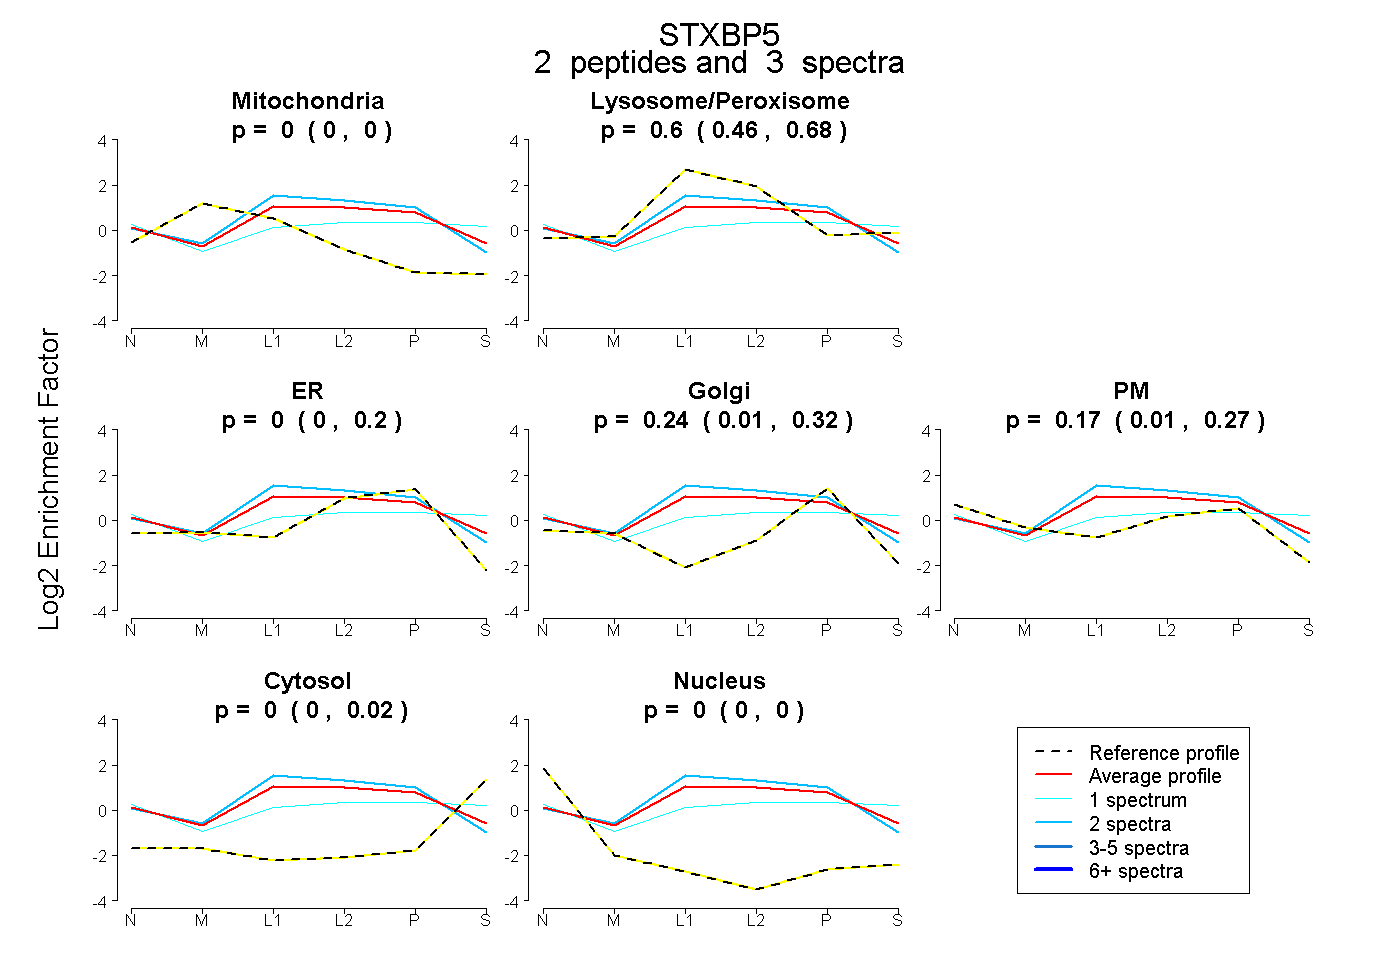
0.000 | 0.000
0.457 | 0.676
0.000 | 0.199
0.006 | 0.320
0.008 | 0.274
0.000 | 0.017
0.000 | 0.004
5peptides
spectra
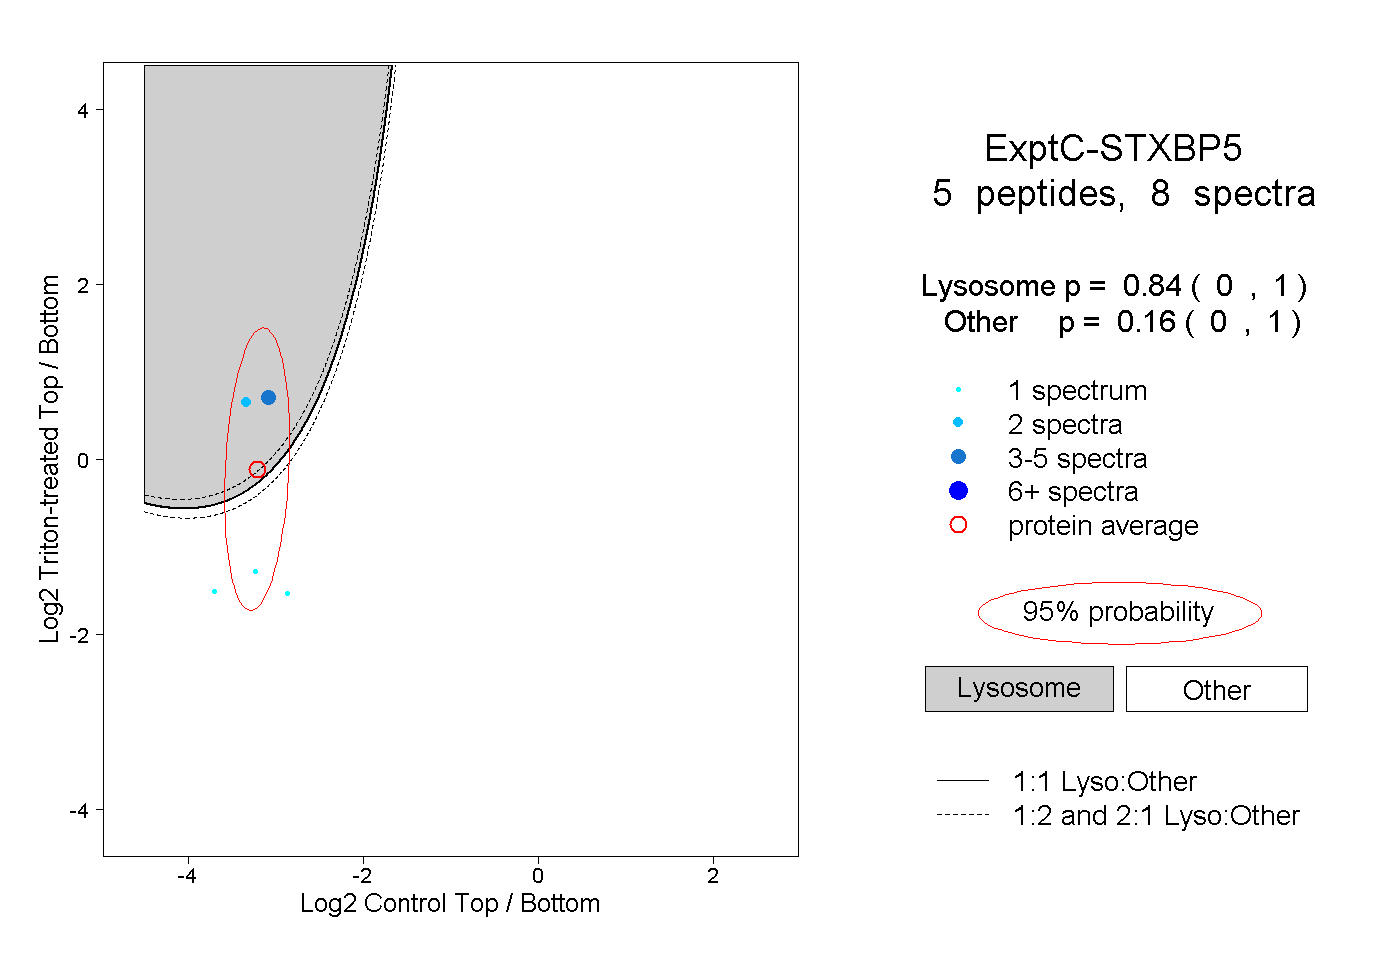
0.000 | 1.000
0.000 | 1.000
1peptide
spectrum
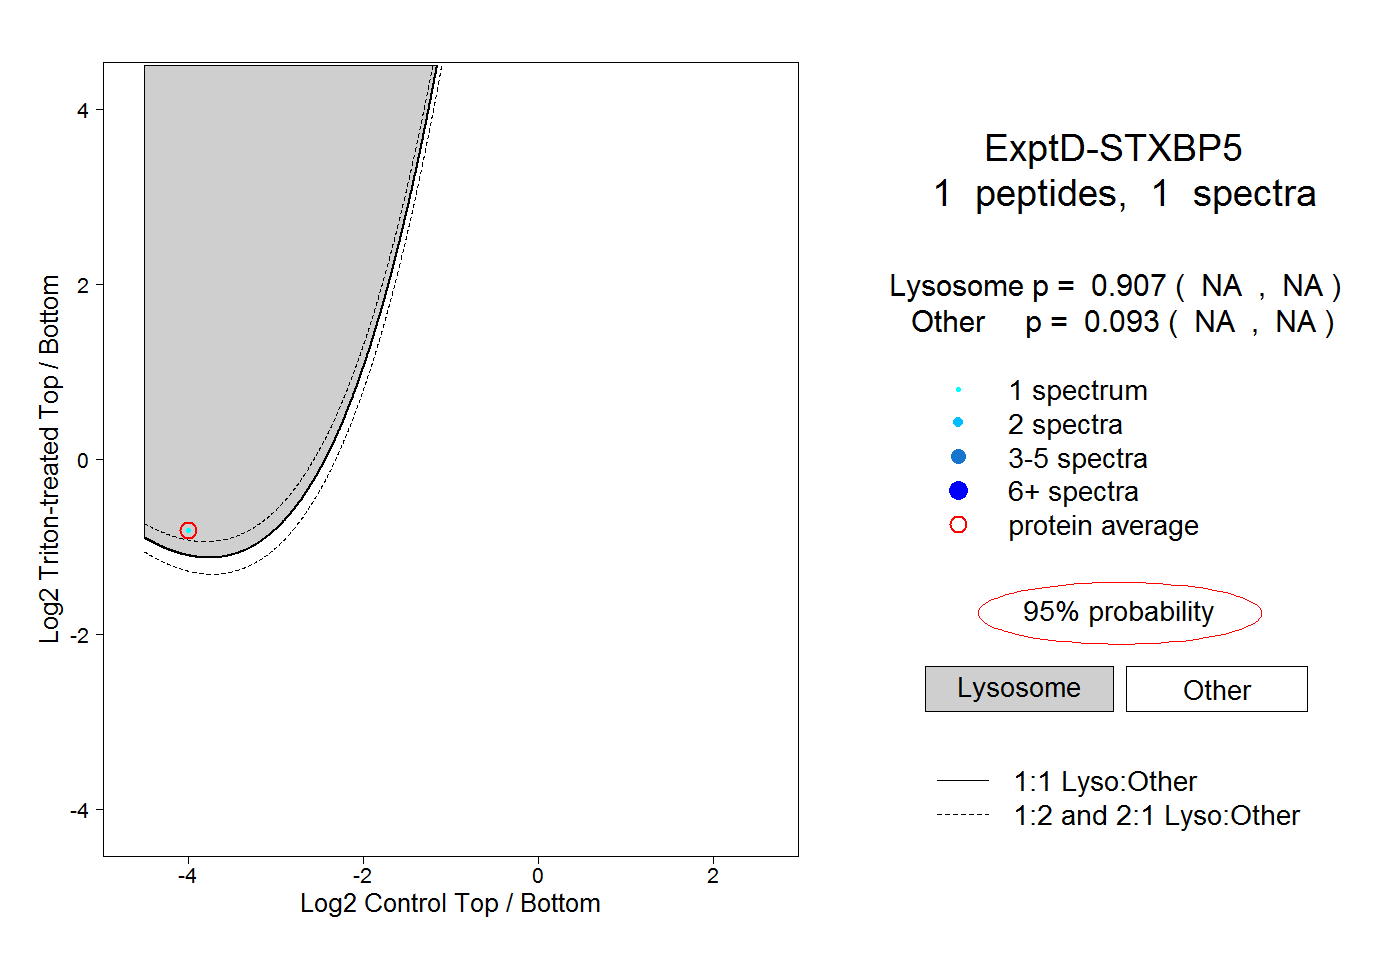
NA | NA
NA | NA