 3
3peptides
spectra
0.000 | 0.080
0.070 | 0.412
0.097 | 0.353
0.000 | 0.000
0.000 | 0.000
0.000 | 0.321
0.252 | 0.376
0.000 | 0.122
| Plot | Mito | Lyso | Perox | ER | Golgi | PM | Cytosol | Nucleus | |||||
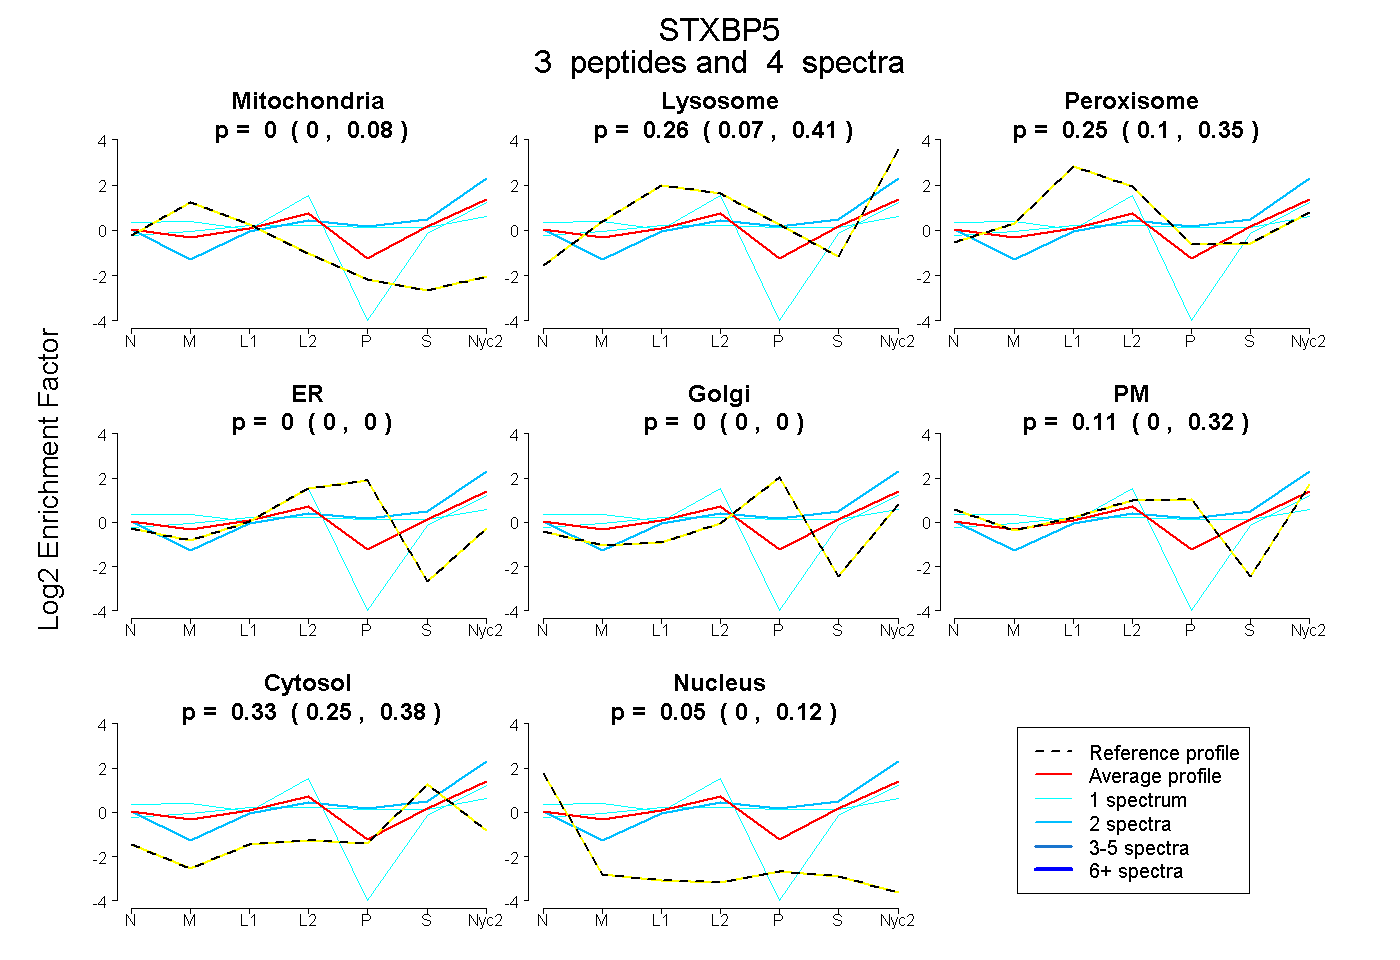
| Expt A |
3 peptides |
4 spectra |
|
0.000 0.000 | 0.080 |
0.261 0.070 | 0.412 |
0.250 0.097 | 0.353 |
0.000 0.000 | 0.000 |
0.000 0.000 | 0.000 |
0.113 0.000 | 0.321 |
0.326 0.252 | 0.376 |
0.051 0.000 | 0.122 |
| 2 spectra, ILAVGTQTGALR | 0.000 | 0.363 | 0.000 | 0.000 | 0.000 | 0.260 | 0.377 | 0.000 | ||
| 1 spectrum, EAISALHFCETFTR | 0.014 | 0.053 | 0.288 | 0.000 | 0.042 | 0.265 | 0.338 | 0.000 | ||
| 1 spectrum, RPCLTVMHGK | 0.200 | 0.116 | 0.443 | 0.000 | 0.000 | 0.000 | 0.184 | 0.056 |
| Plot | Mito | Lyso or Perox | ER | Golgi | PM | Cytosol | Nucleus | ||||||
| Expt B |
2 peptides |
3 spectra |
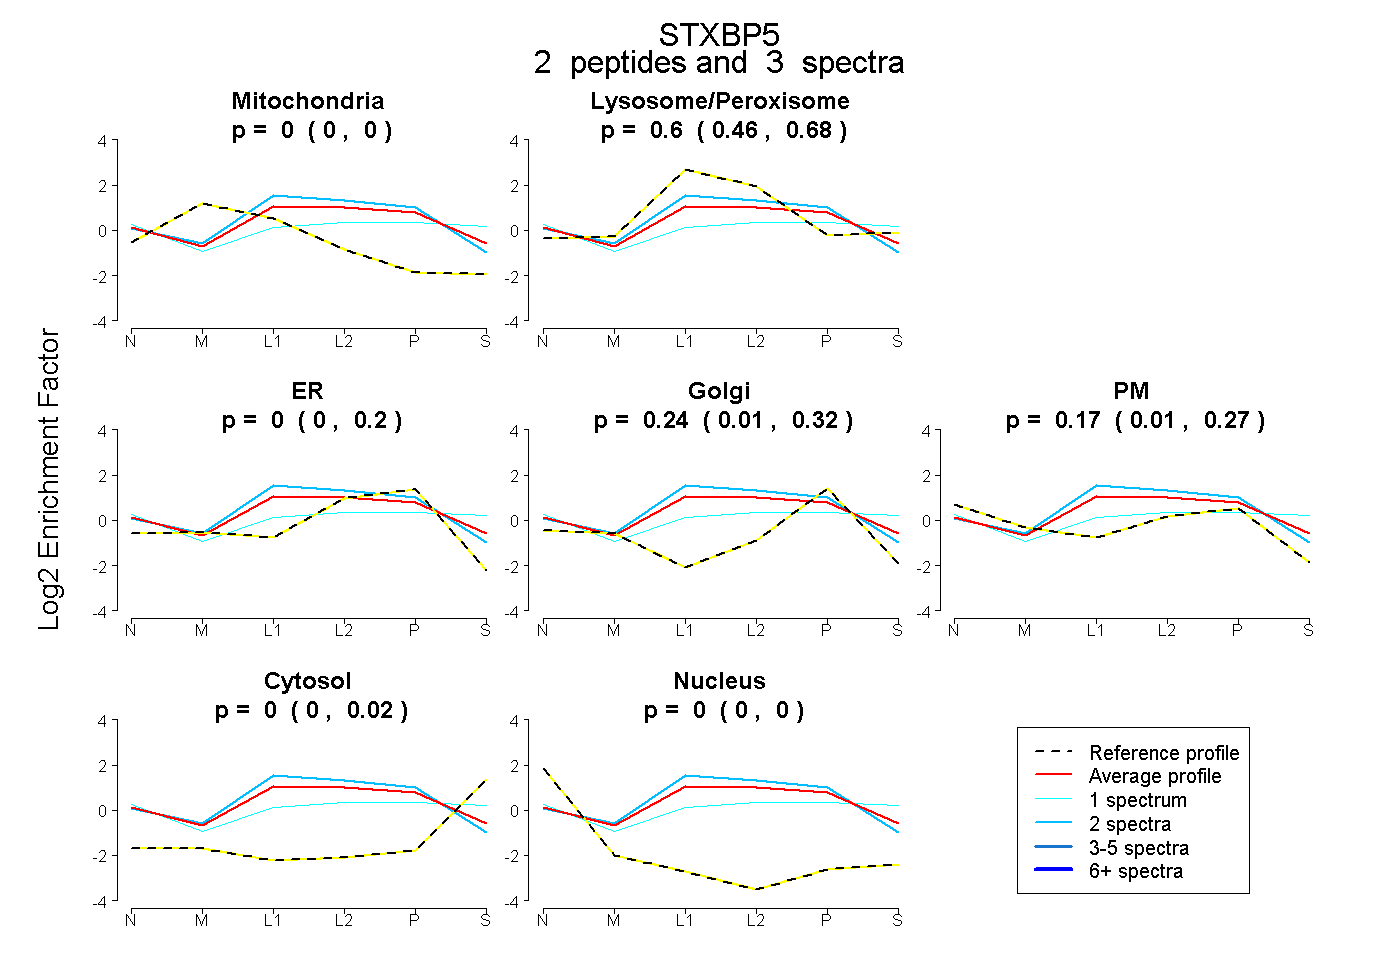 |
0.000 0.000 | 0.000 |
0.597 0.457 | 0.676 |
0.000 0.000 | 0.199 |
0.238 0.006 | 0.320 |
0.165 0.008 | 0.274 |
0.000 0.000 | 0.017 |
0.000 0.000 | 0.004 |
|||
| Plot | Lyso | Other | |||||||||||
| Expt C |
5 peptides |
8 spectra |
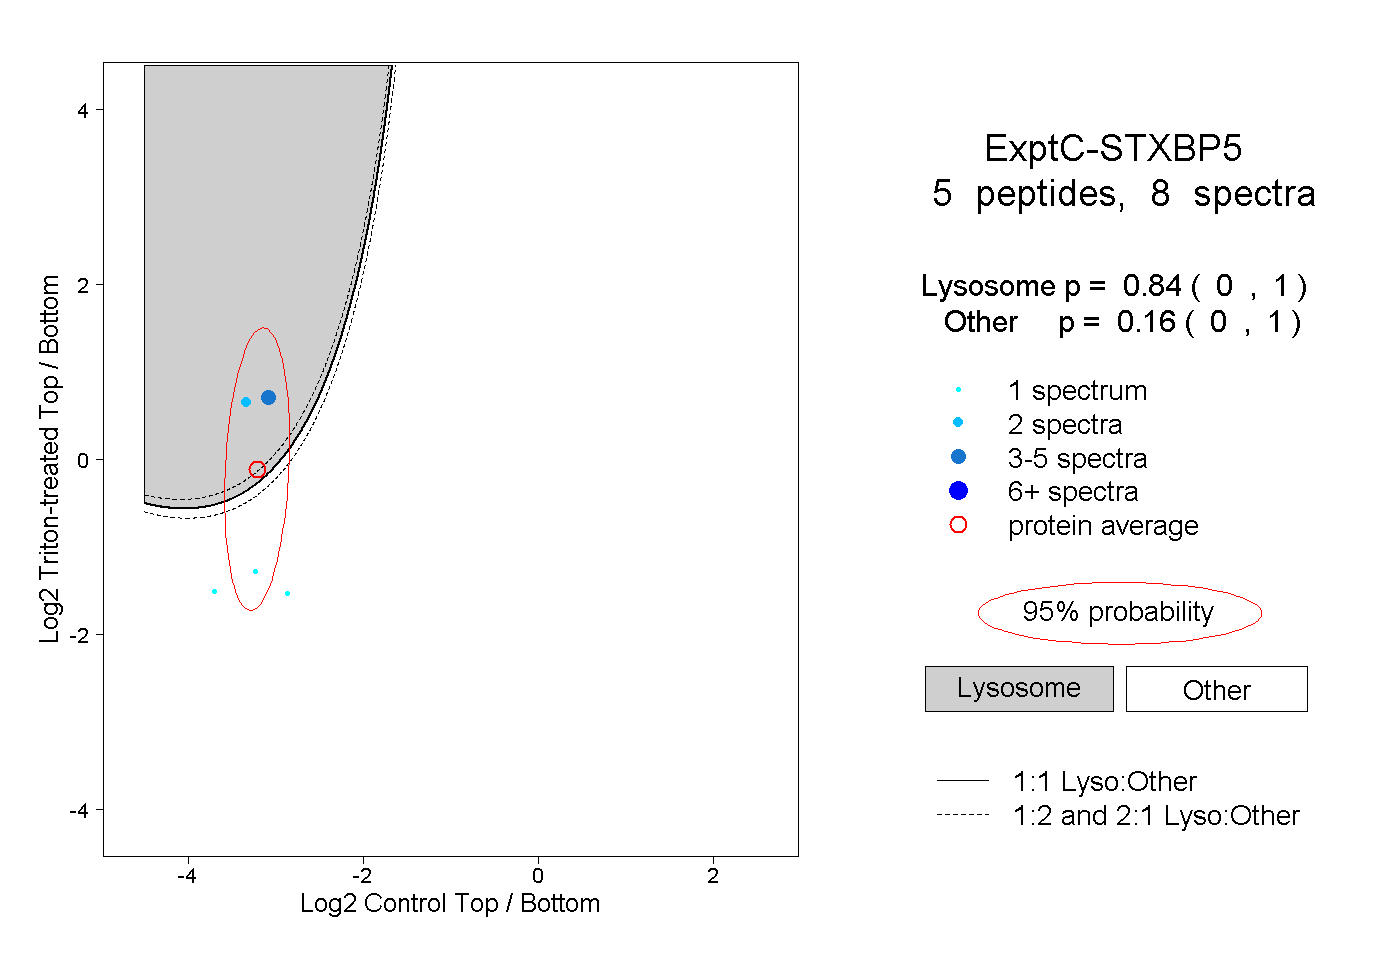 |
0.840 0.000 | 1.000 |
0.160 0.000 | 1.000 |
||||||||
| Plot | Lyso | Other | |||||||||||
| Expt D |
1 peptide |
1 spectrum |
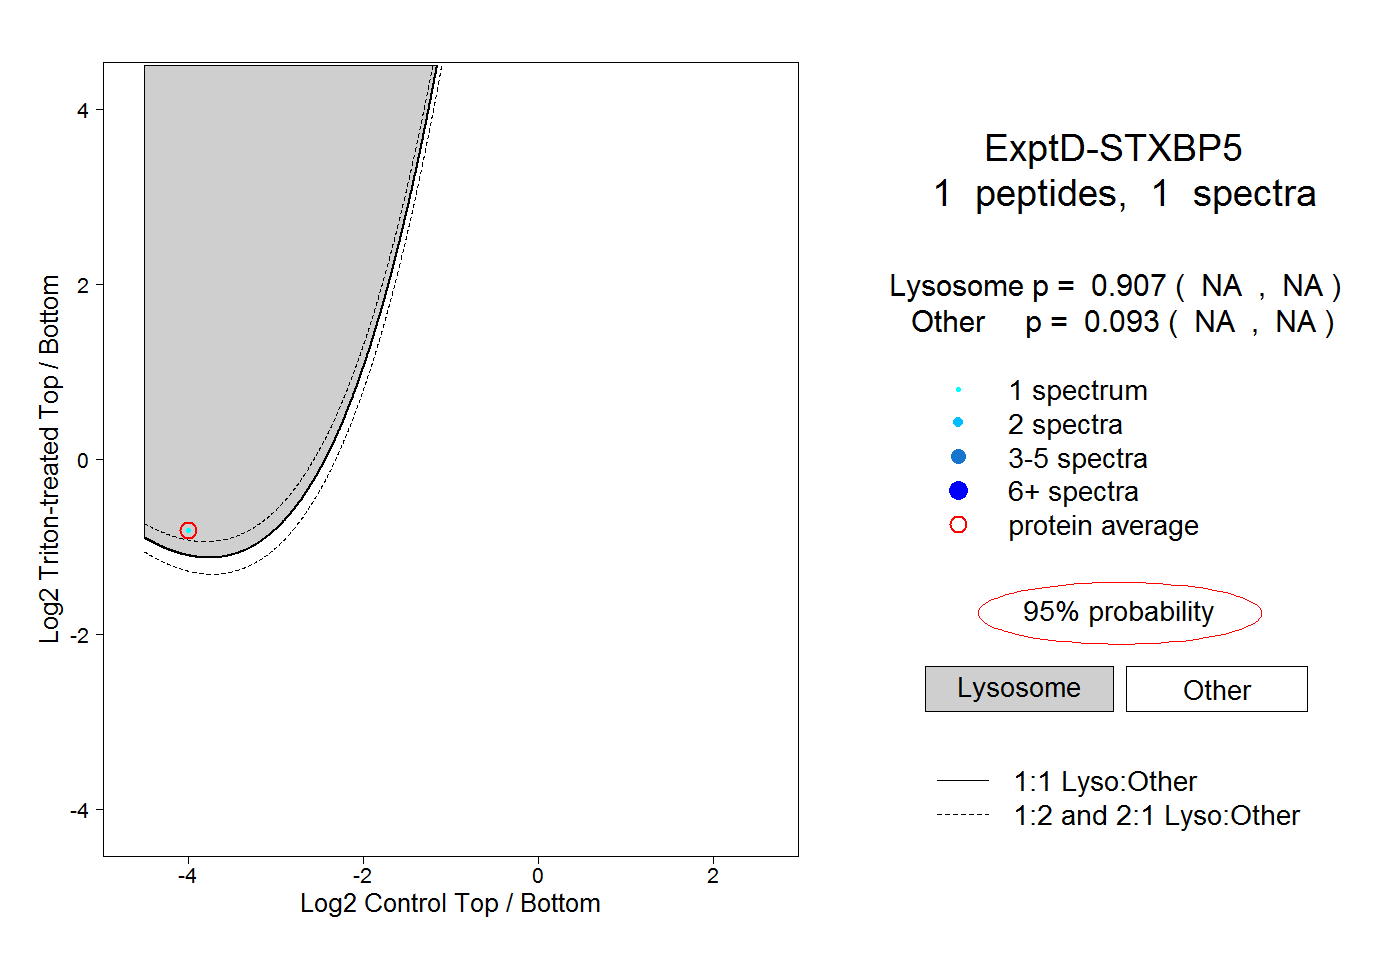 |
0.907 NA | NA |
0.093 NA | NA |