 15
15peptides
spectra
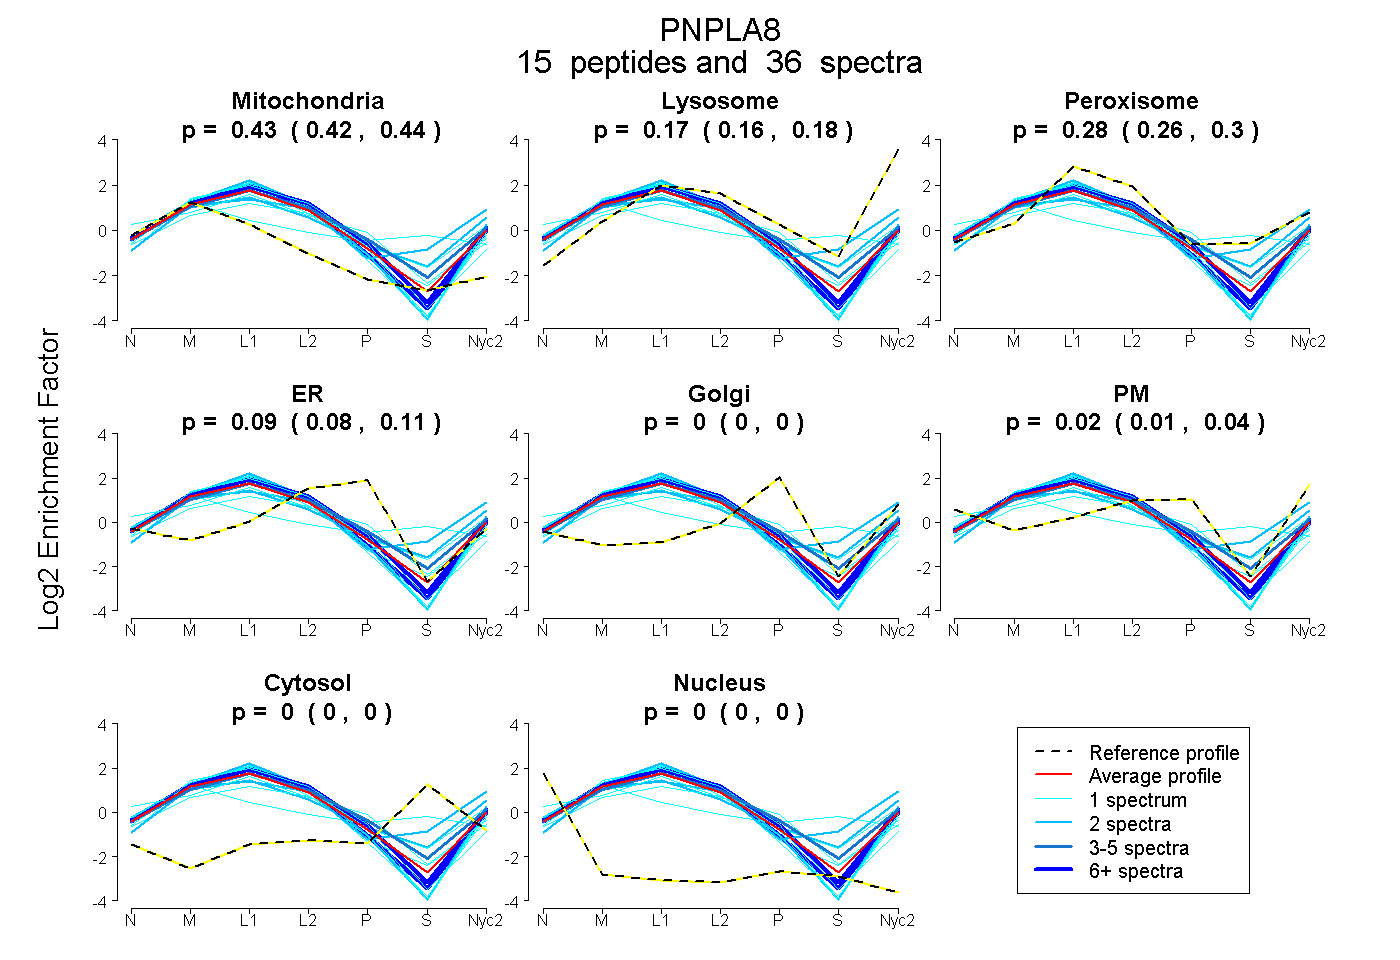
0.422 | 0.438
0.158 | 0.184
0.257 | 0.301
0.077 | 0.105
0.000 | 0.000
0.006 | 0.038
0.000 | 0.000
0.000 | 0.000
8peptides
spectra
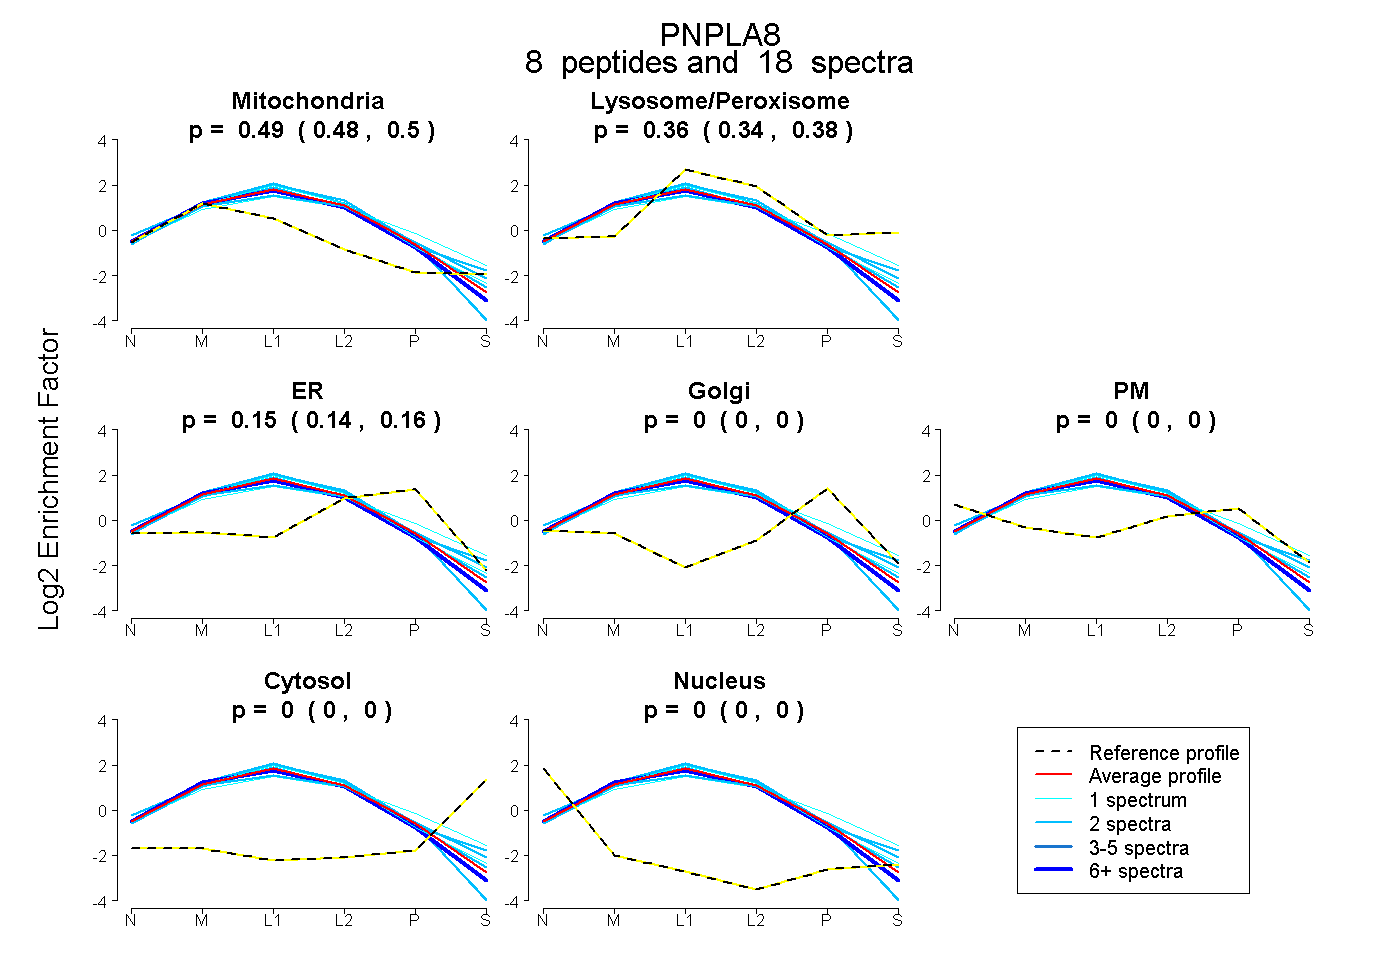
0.481 | 0.498
0.340 | 0.375
0.136 | 0.162
0.000 | 0.000
0.000 | 0.000
0.000 | 0.000
0.000 | 0.000
23peptides
spectra
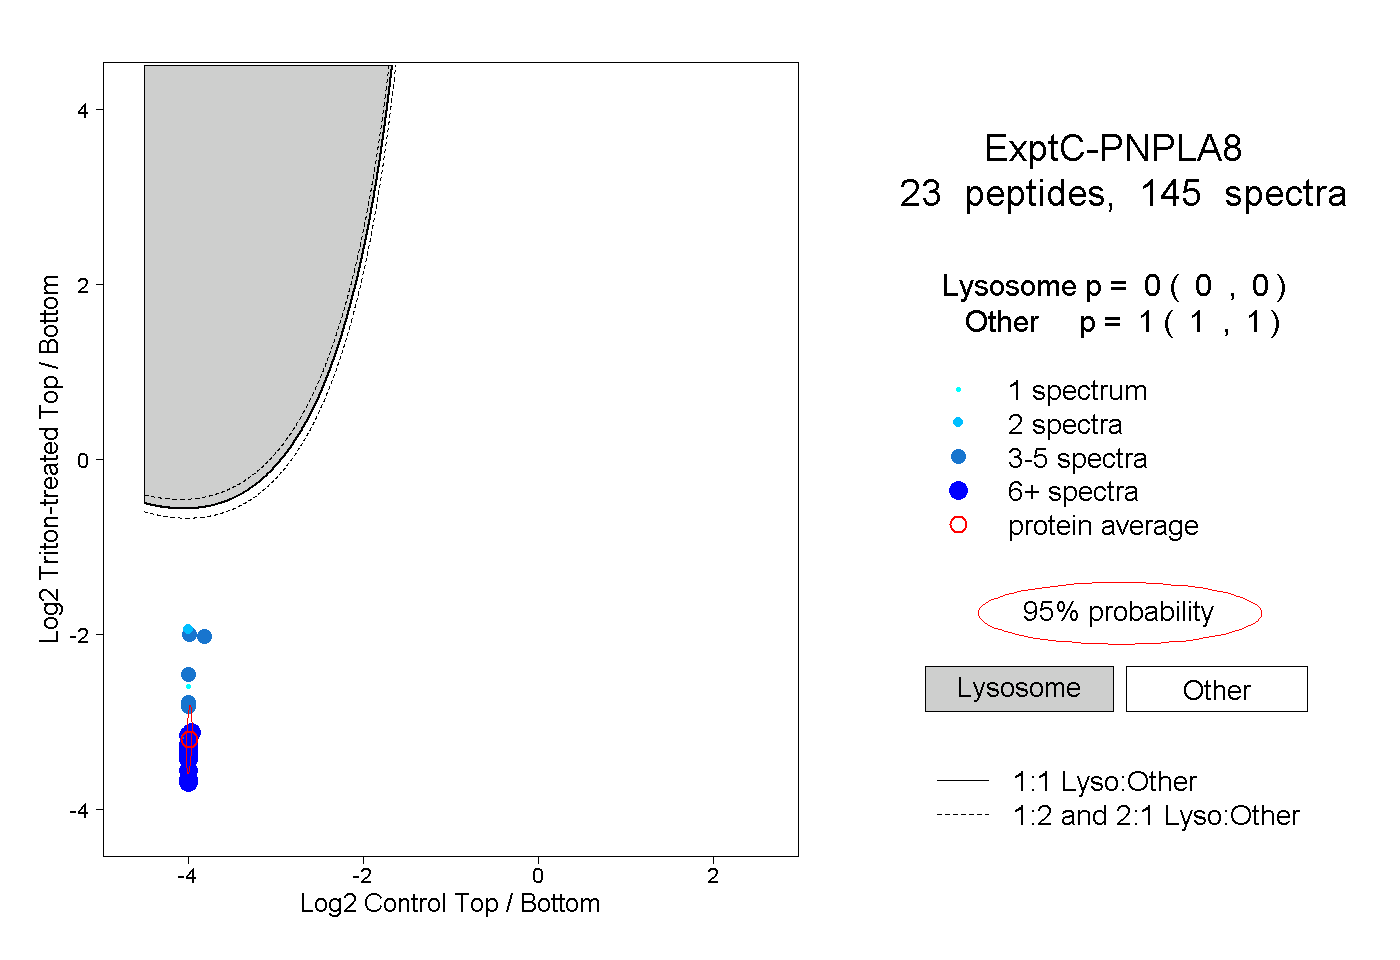
0.000 | 0.000
1.000 | 1.000
4peptides
spectra
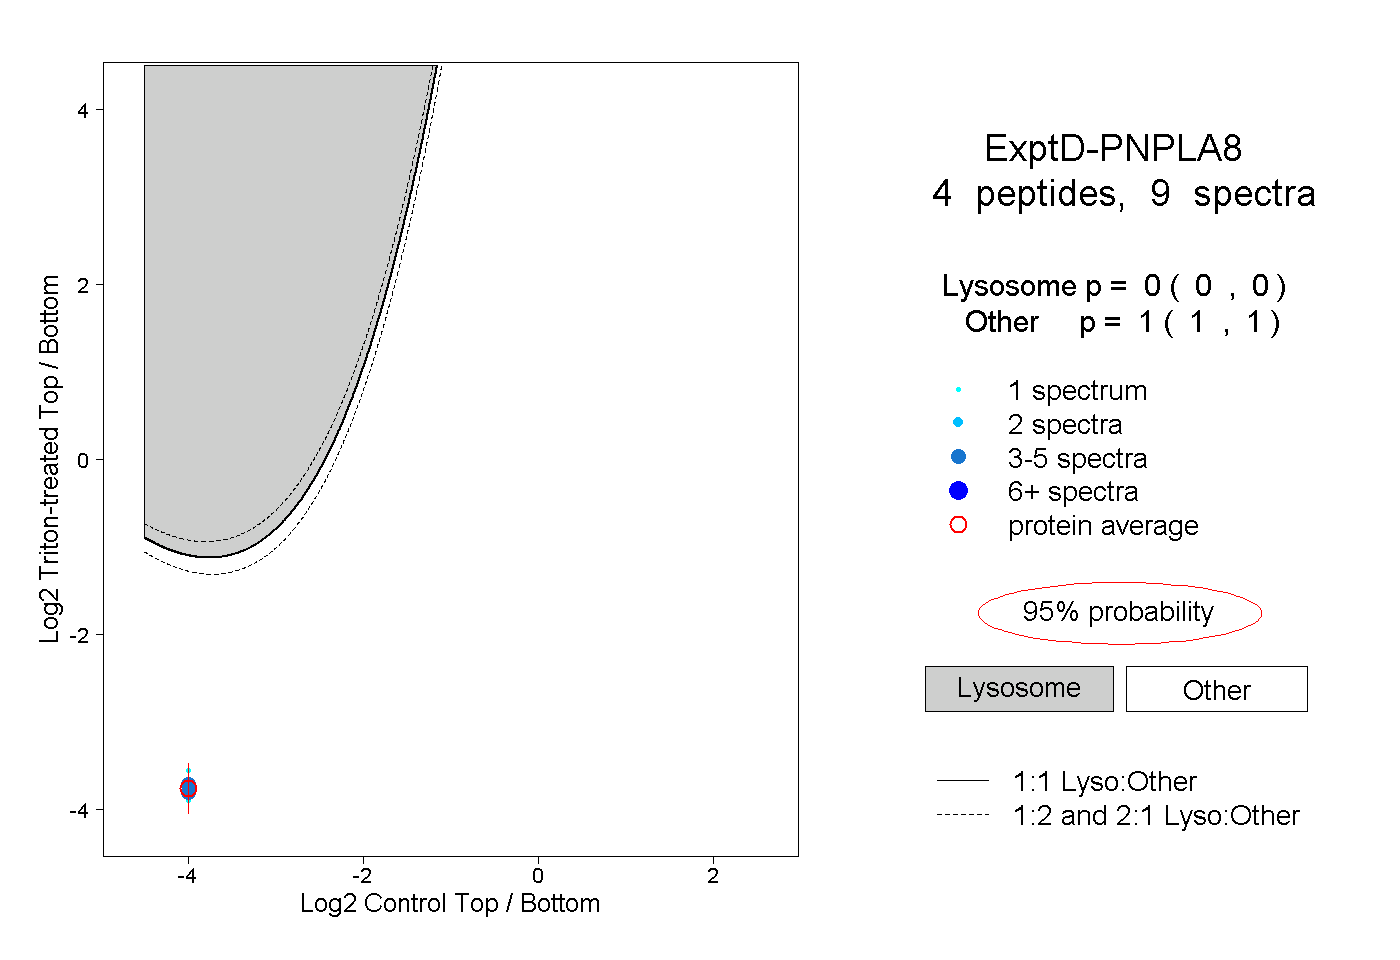
0.000 | 0.000
1.000 | 1.000