 15
15peptides
spectra
0.422 | 0.438
0.158 | 0.184
0.257 | 0.301
0.077 | 0.105
0.000 | 0.000
0.006 | 0.038
0.000 | 0.000
0.000 | 0.000
| Plot | Mito | Lyso | Perox | ER | Golgi | PM | Cytosol | Nucleus | |||||
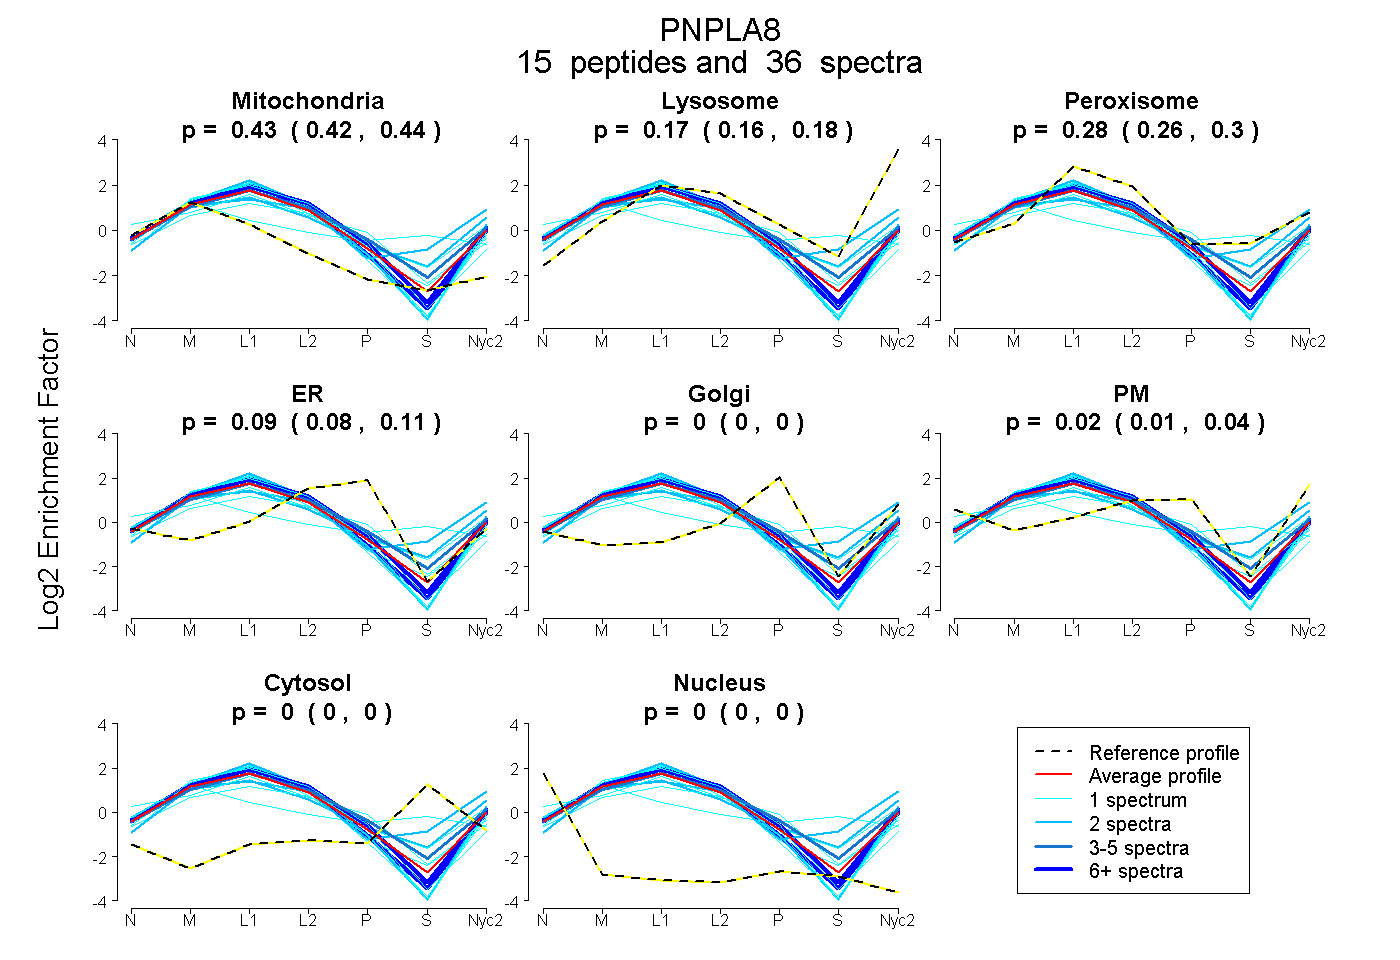
| Expt A |
15 peptides |
36 spectra |
|
0.431 0.422 | 0.438 |
0.173 0.158 | 0.184 |
0.281 0.257 | 0.301 |
0.093 0.077 | 0.105 |
0.000 0.000 | 0.000 |
0.023 0.006 | 0.038 |
0.000 0.000 | 0.000 |
0.000 0.000 | 0.000 |
| 1 spectrum, SDMYEGLPFFSK | 0.550 | 0.225 | 0.145 | 0.080 | 0.000 | 0.000 | 0.000 | 0.000 | ||
| 2 spectra, IIPYLLR | 0.453 | 0.190 | 0.215 | 0.000 | 0.000 | 0.142 | 0.000 | 0.000 | ||
| 2 spectra, VGSALMIETAR | 0.311 | 0.337 | 0.322 | 0.000 | 0.000 | 0.000 | 0.031 | 0.000 | ||
| 1 spectrum, FNPVICENIPLDESR | 0.450 | 0.000 | 0.532 | 0.018 | 0.000 | 0.000 | 0.000 | 0.000 | ||
| 8 spectra, GVVALQTLR | 0.465 | 0.161 | 0.272 | 0.045 | 0.000 | 0.057 | 0.000 | 0.000 | ||
| 1 spectrum, VEELTFHLLEFPEGK | 0.455 | 0.326 | 0.044 | 0.175 | 0.000 | 0.000 | 0.000 | 0.000 | ||
| 1 spectrum, EILALIGYVDPVK | 0.296 | 0.060 | 0.566 | 0.000 | 0.000 | 0.078 | 0.000 | 0.000 | ||
| 1 spectrum, ISDGEIK | 0.438 | 0.183 | 0.185 | 0.071 | 0.000 | 0.123 | 0.000 | 0.000 | ||
| 1 spectrum, VSIDNR | 0.340 | 0.000 | 0.323 | 0.163 | 0.000 | 0.174 | 0.000 | 0.000 | ||
| 3 spectra, YESDVR | 0.327 | 0.147 | 0.377 | 0.132 | 0.000 | 0.017 | 0.000 | 0.000 | ||
| 2 spectra, DETLQAAVR | 0.364 | 0.213 | 0.296 | 0.000 | 0.000 | 0.128 | 0.000 | 0.000 | ||
| 1 spectrum, LAQFKPSSR | 0.613 | 0.009 | 0.000 | 0.195 | 0.000 | 0.183 | 0.000 | 0.000 | ||
| 10 spectra, VAAVSTIVNR | 0.386 | 0.205 | 0.245 | 0.155 | 0.000 | 0.009 | 0.000 | 0.000 | ||
| 1 spectrum, NTTTYTSLK | 0.543 | 0.223 | 0.198 | 0.036 | 0.000 | 0.000 | 0.000 | 0.000 | ||
| 1 spectrum, LDQLQLEGMK | 0.230 | 0.000 | 0.539 | 0.056 | 0.000 | 0.000 | 0.175 | 0.000 |
| Plot | Mito | Lyso or Perox | ER | Golgi | PM | Cytosol | Nucleus | ||||||
| Expt B |
8 peptides |
18 spectra |
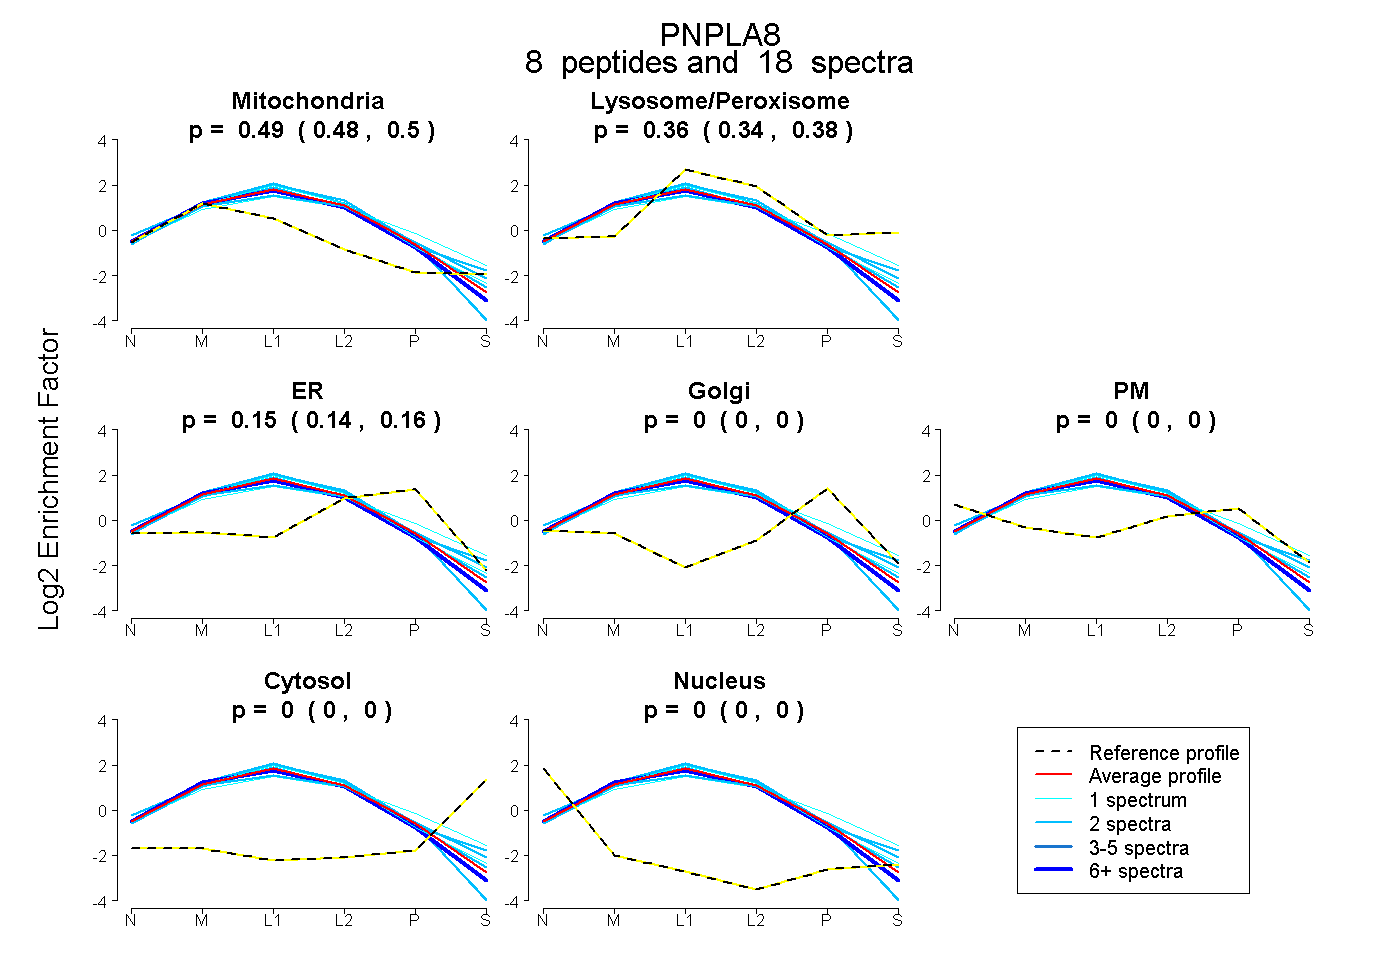 |
0.490 0.481 | 0.498 |
0.360 0.340 | 0.375 |
0.150 0.136 | 0.162 |
0.000 0.000 | 0.000 |
0.000 0.000 | 0.000 |
0.000 0.000 | 0.000 |
0.000 0.000 | 0.000 |
|||
| Plot | Lyso | Other | |||||||||||
| Expt C |
23 peptides |
145 spectra |
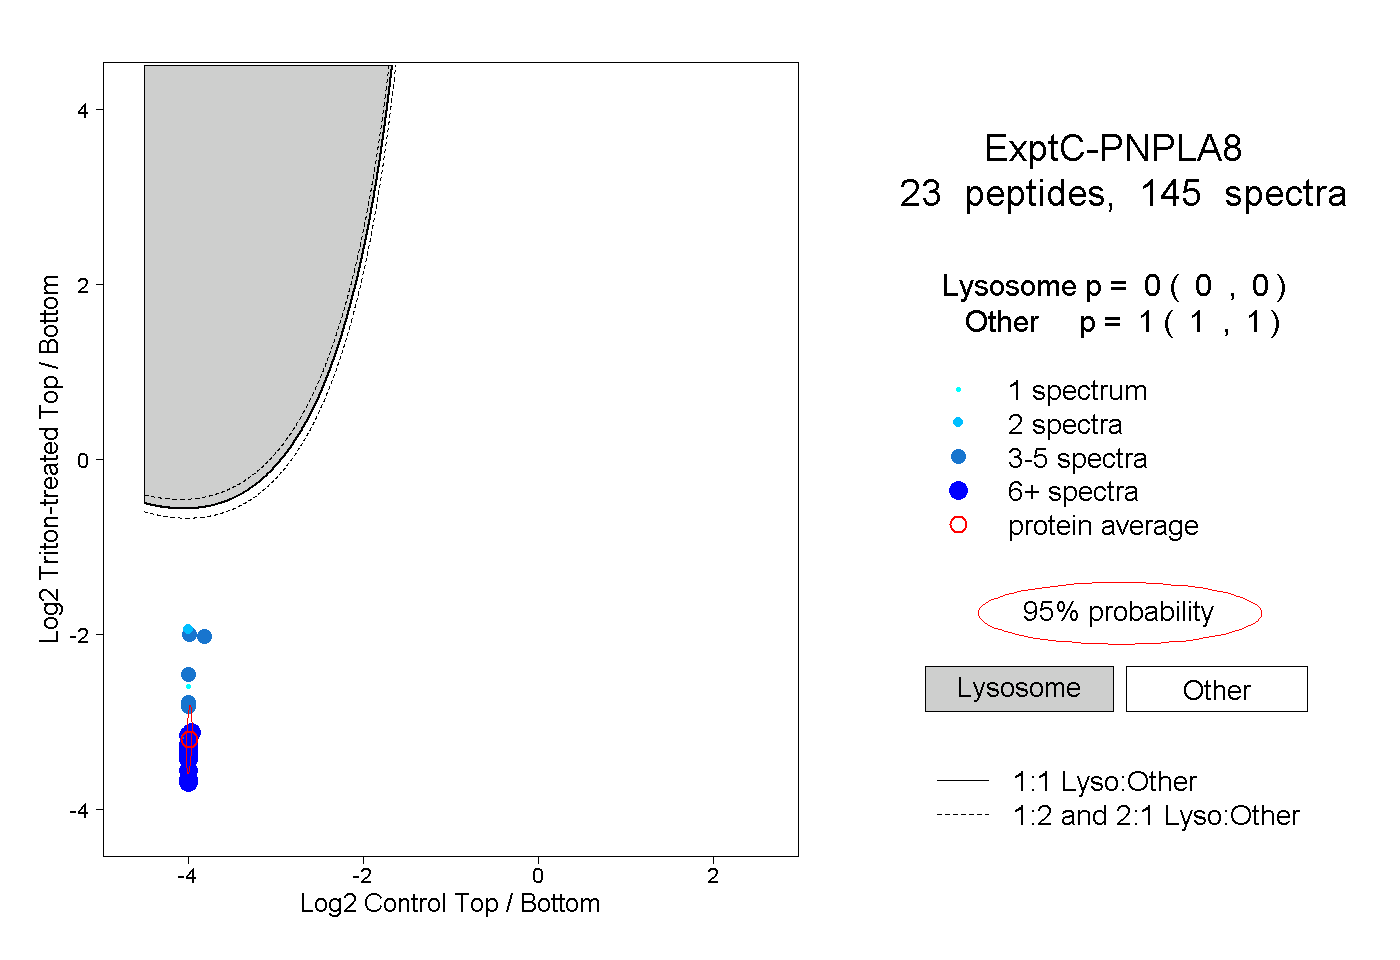 |
0.000 0.000 | 0.000 |
1.000 1.000 | 1.000 |
||||||||
| Plot | Lyso | Other | |||||||||||
| Expt D |
4 peptides |
9 spectra |
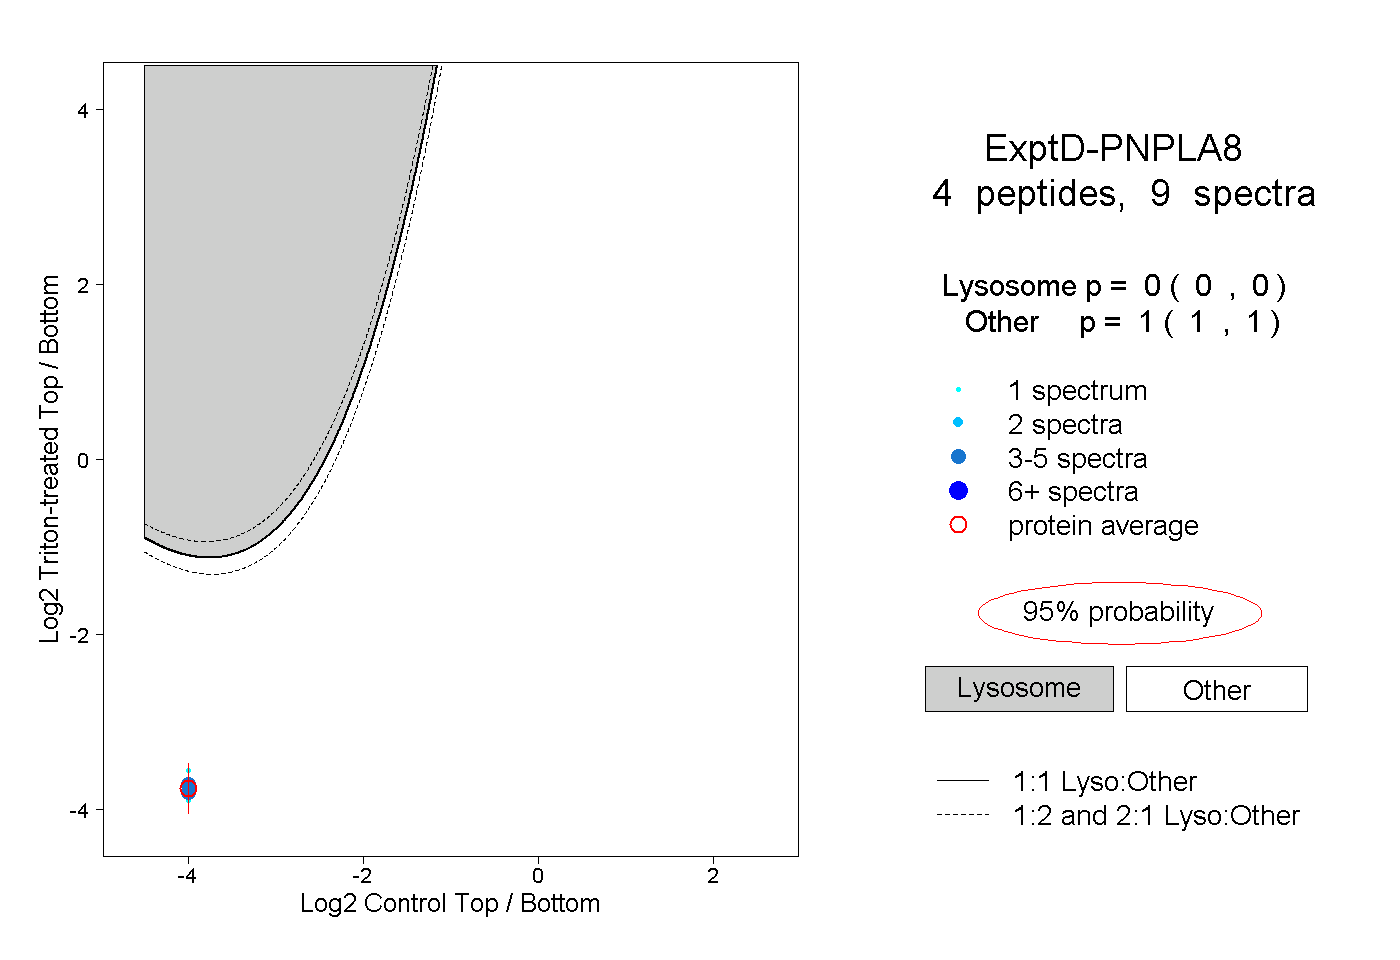 |
0.000 0.000 | 0.000 |
1.000 1.000 | 1.000 |