 3
3peptides
spectra
0.000 | 0.000
0.224 | 0.306
0.000 | 0.060
0.000 | 0.107
0.000 | 0.033
0.130 | 0.257
0.413 | 0.491
0.000 | 0.000
4peptides
spectra
0.000 | 0.000
1.000 | 1.000
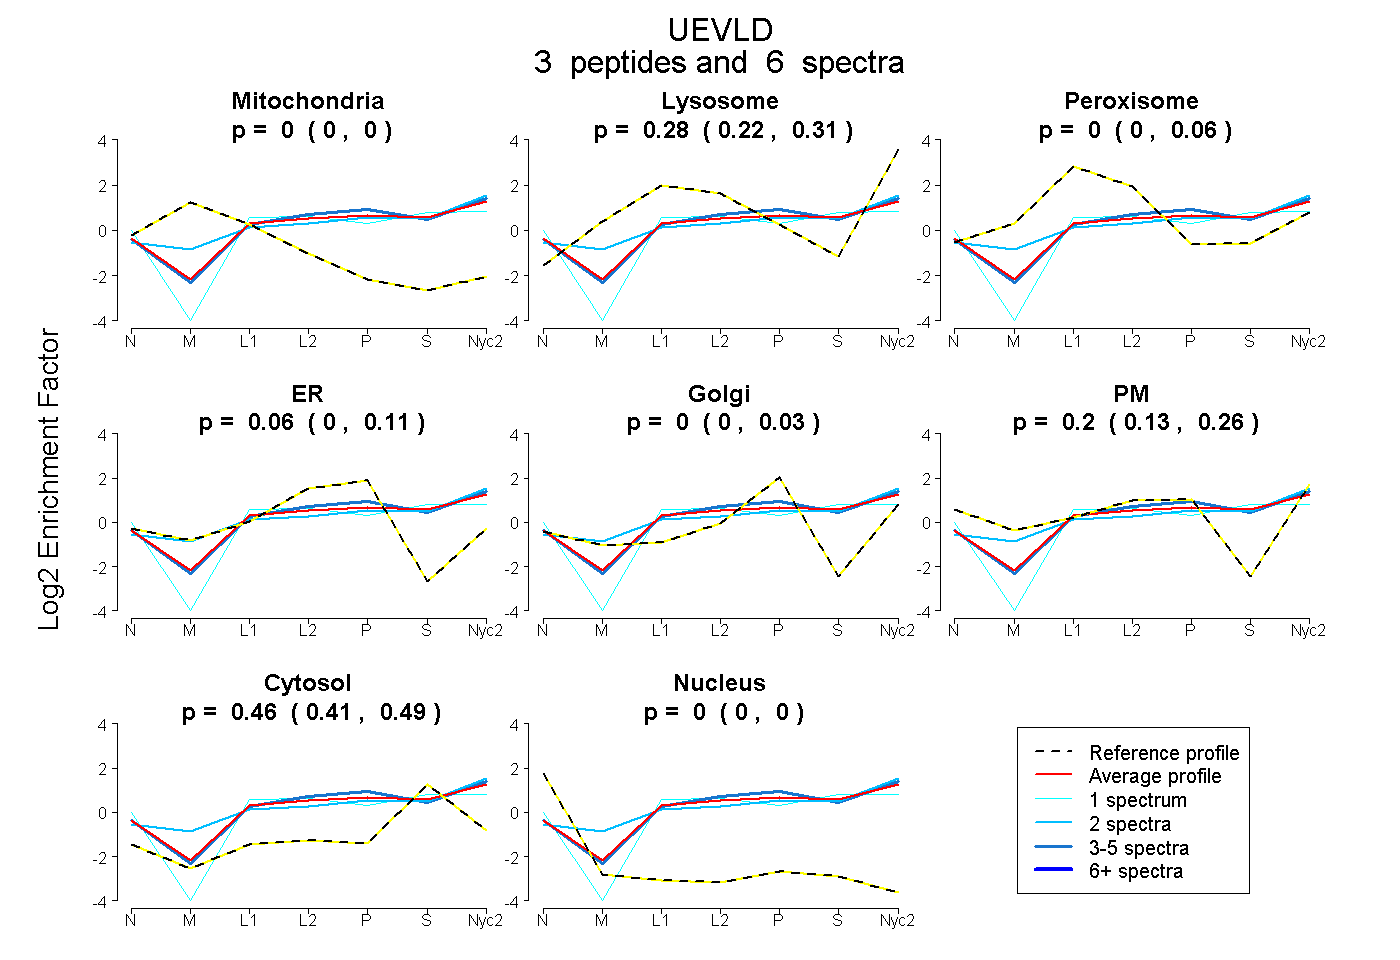
| Plot | Mito | Lyso | Perox | ER | Golgi | PM | Cytosol | Nucleus | |||||
| Expt A |
3 peptides |
6 spectra |
|
0.000 0.000 | 0.000 |
0.280 0.224 | 0.306 |
0.001 0.000 | 0.060 |
0.058 0.000 | 0.107 |
0.000 0.000 | 0.033 |
0.200 0.130 | 0.257 |
0.461 0.413 | 0.491 |
0.000 0.000 | 0.000 |
||
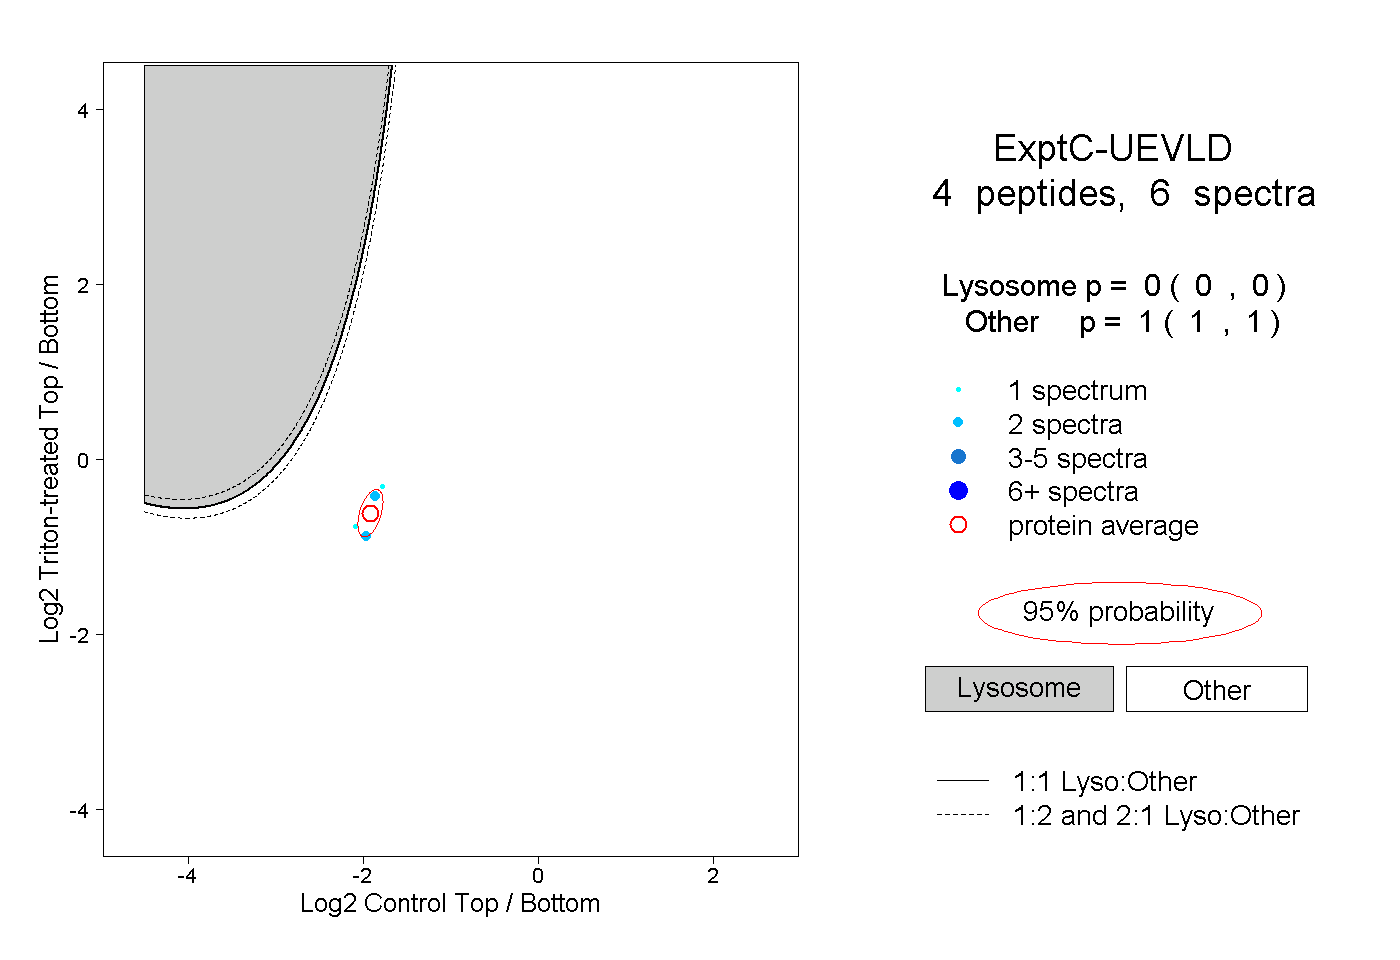
| Plot | Lyso | Other | |||||||||||
| Expt C |
4 peptides |
6 spectra |
|
0.000 0.000 | 0.000 |
1.000 1.000 | 1.000 |