 3
3peptides
spectra
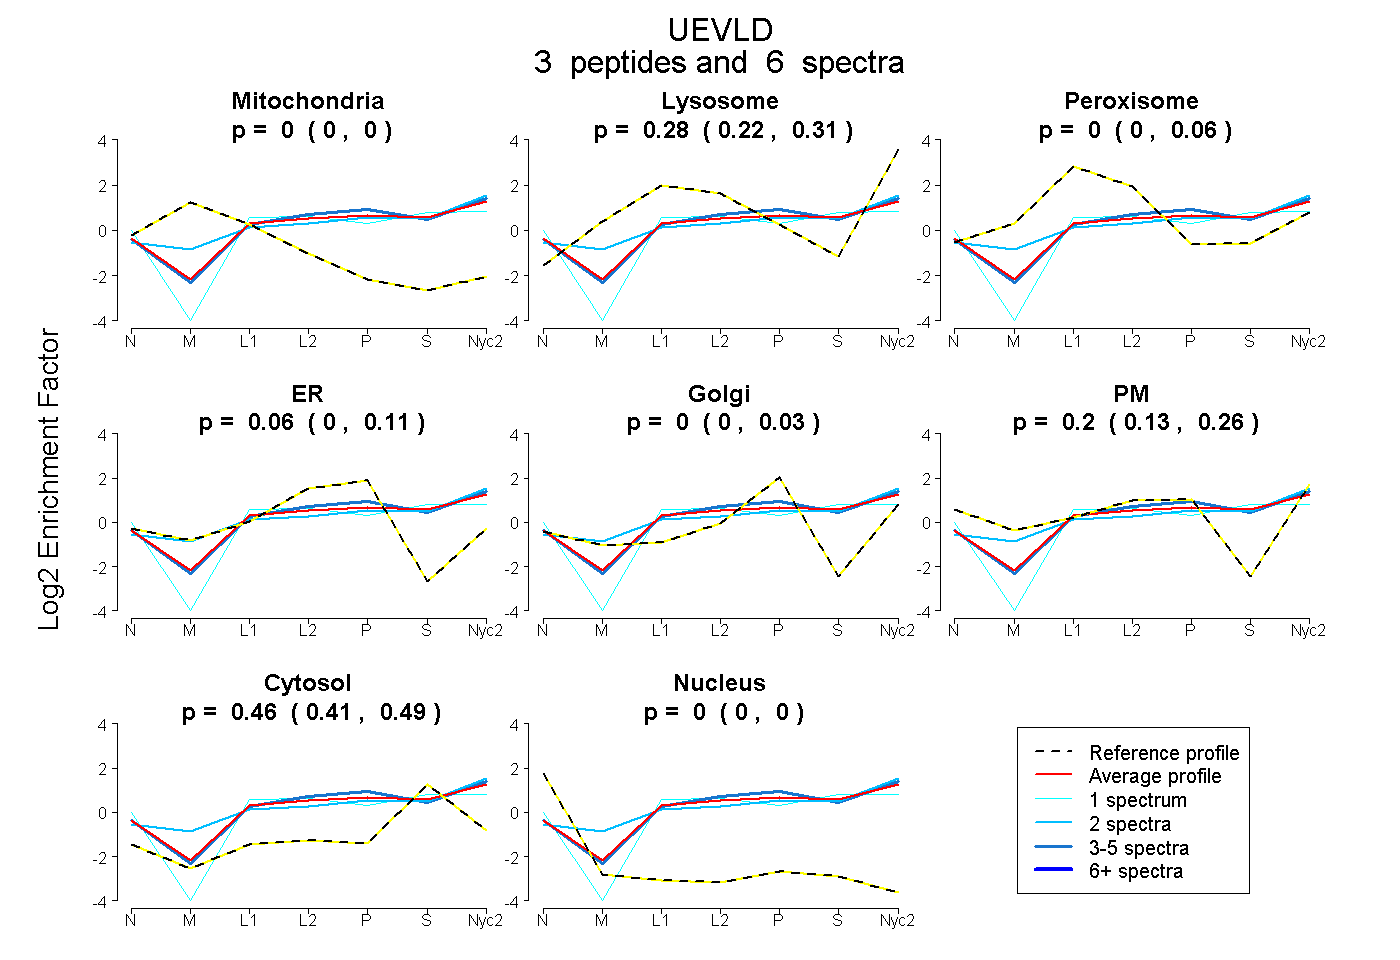
0.000 | 0.000
0.224 | 0.306
0.000 | 0.060
0.000 | 0.107
0.000 | 0.033
0.130 | 0.257
0.413 | 0.491
0.000 | 0.000
| Plot | Mito | Lyso | Perox | ER | Golgi | PM | Cytosol | Nucleus | |||||
| Expt A |
3 peptides |
6 spectra |
|
0.000 0.000 | 0.000 |
0.280 0.224 | 0.306 |
0.001 0.000 | 0.060 |
0.058 0.000 | 0.107 |
0.000 0.000 | 0.033 |
0.200 0.130 | 0.257 |
0.461 0.413 | 0.491 |
0.000 0.000 | 0.000 |
| 3 spectra, DLTVEELK | 0.000 | 0.288 | 0.000 | 0.096 | 0.036 | 0.163 | 0.416 | 0.000 | ||
| 2 spectra, TYNIPIR | 0.000 | 0.379 | 0.000 | 0.000 | 0.037 | 0.180 | 0.405 | 0.000 | ||
| 1 spectrum, DLLNFTGTIPVMYQGK | 0.000 | 0.044 | 0.134 | 0.022 | 0.000 | 0.233 | 0.567 | 0.000 |
| Plot | Lyso | Other | |||||||||||
| Expt C |
4 peptides |
6 spectra |
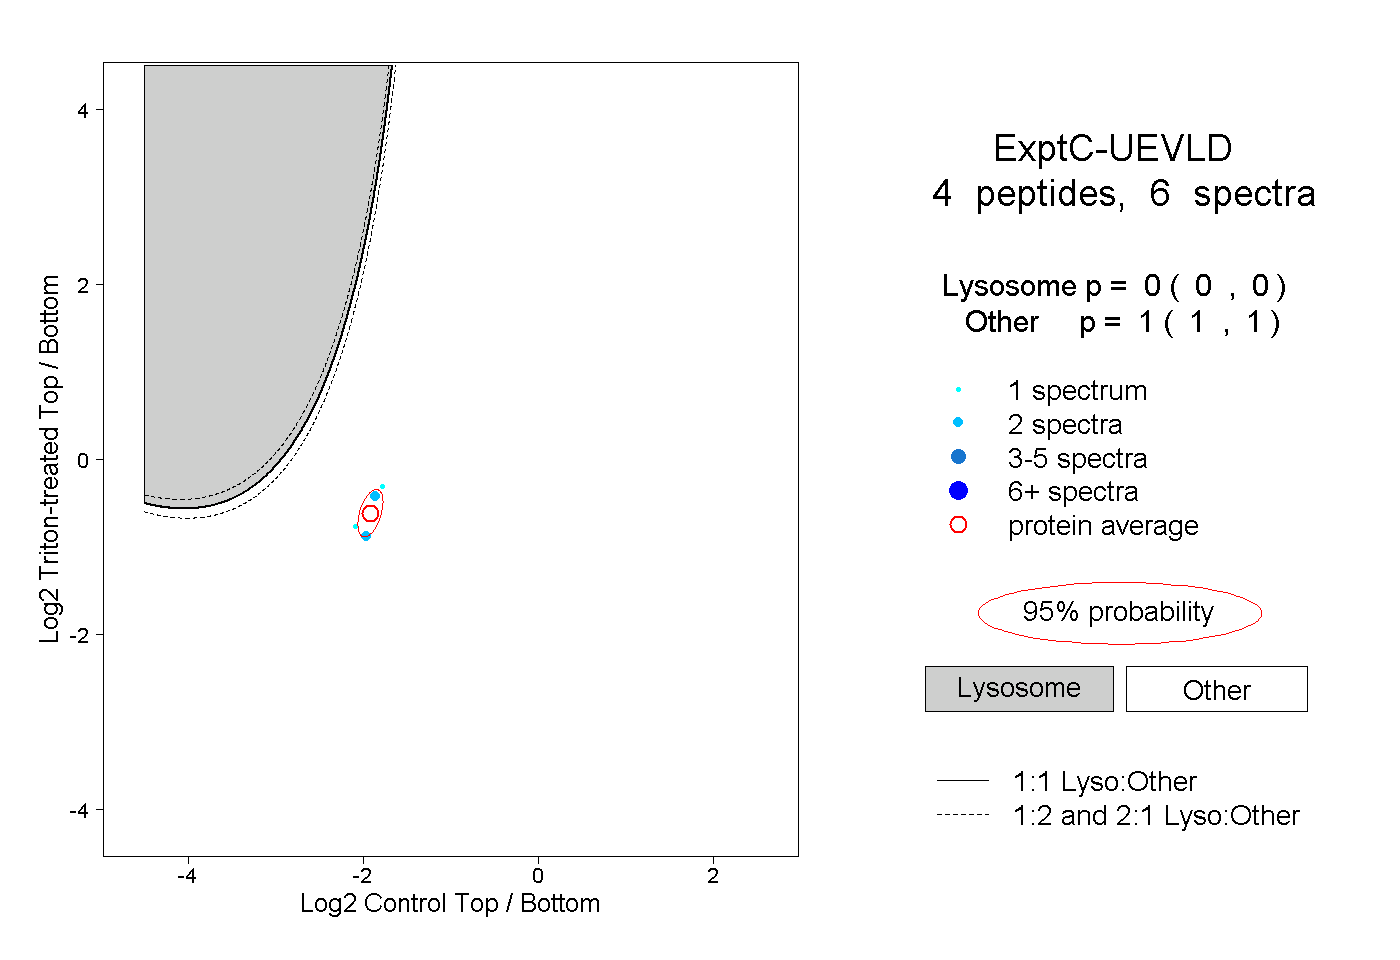 |
0.000 0.000 | 0.000 |
1.000 1.000 | 1.000 |