 12
12peptides
spectra
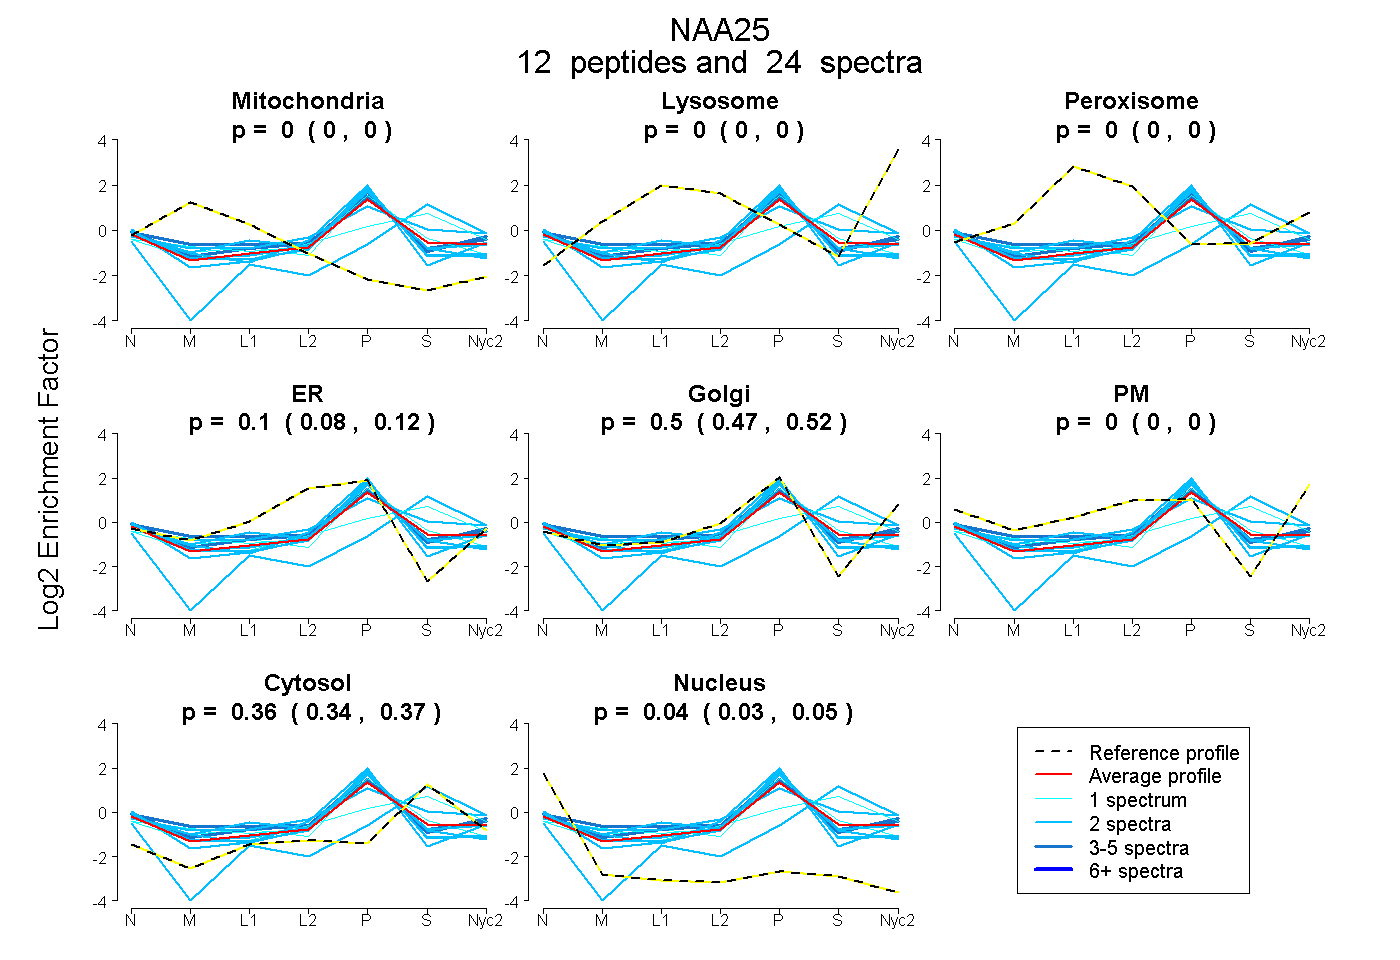
0.000 | 0.000
0.000 | 0.000
0.000 | 0.000
0.079 | 0.121
0.470 | 0.524
0.000 | 0.000
0.341 | 0.374
0.030 | 0.049
2peptides
spectra
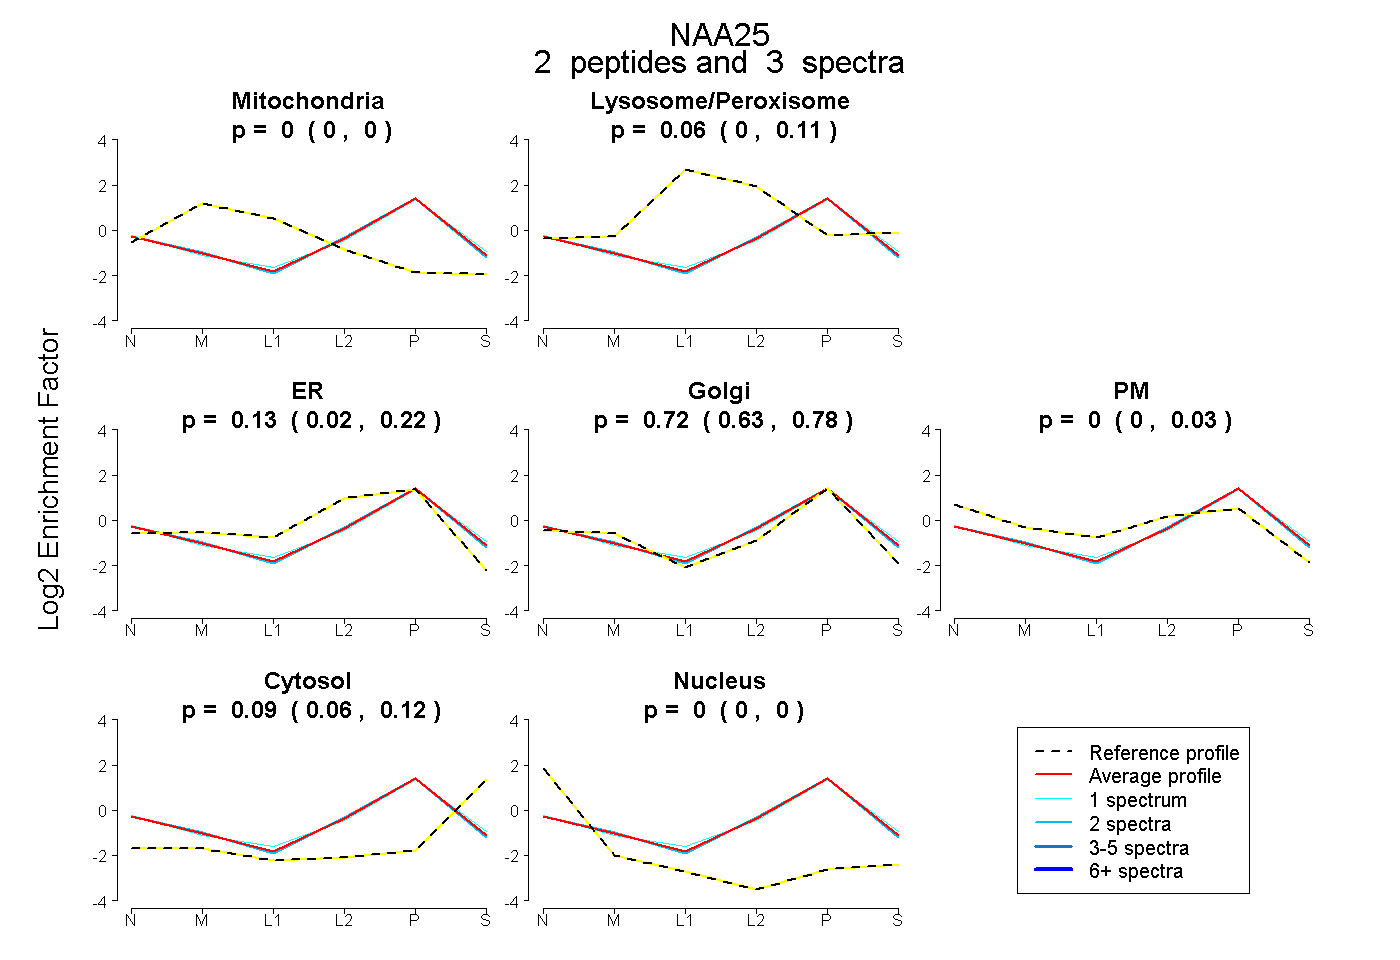
0.000 | 0.000
0.000 | 0.107
0.023 | 0.218
0.629 | 0.783
0.000 | 0.035
0.062 | 0.119
0.000 | 0.000
6peptides
spectra
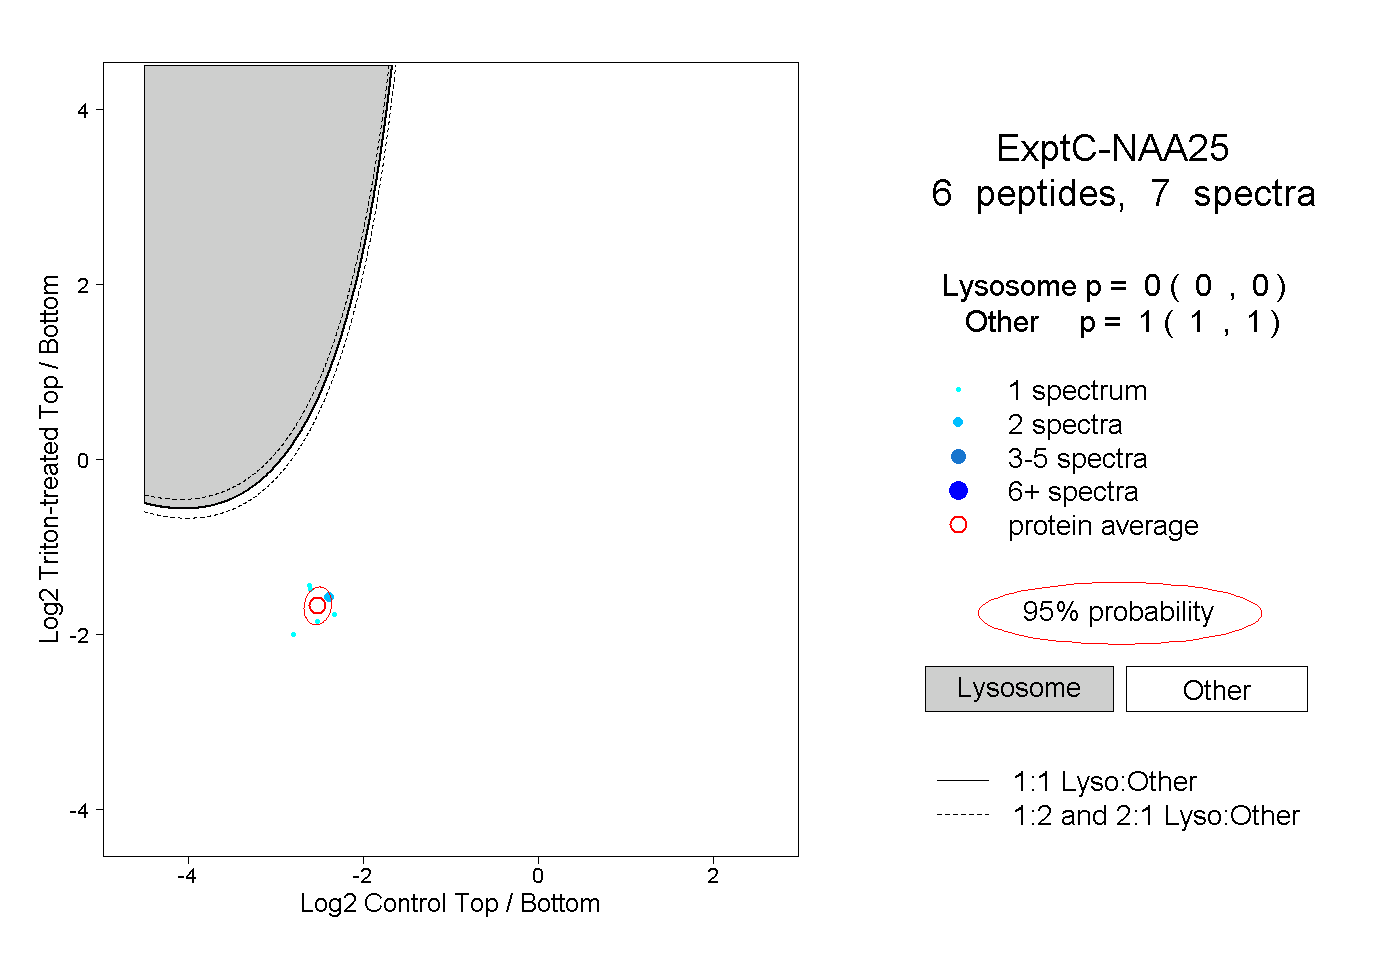
0.000 | 0.000
1.000 | 1.000