 12
12peptides
spectra
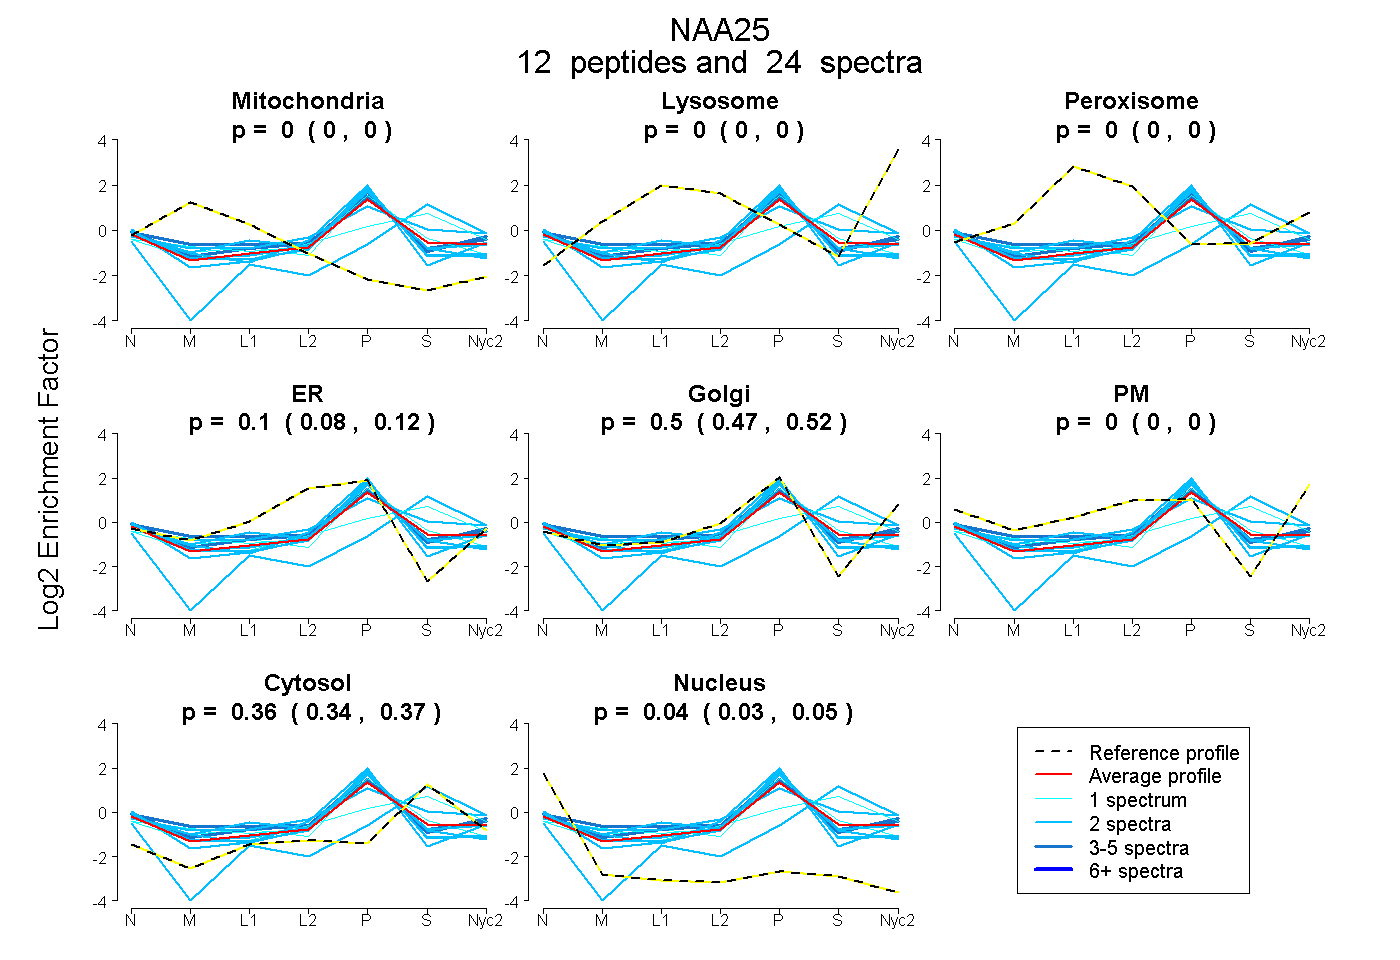
0.000 | 0.000
0.000 | 0.000
0.000 | 0.000
0.079 | 0.121
0.470 | 0.524
0.000 | 0.000
0.341 | 0.374
0.030 | 0.049
| Plot | Mito | Lyso | Perox | ER | Golgi | PM | Cytosol | Nucleus | |||||
| Expt A |
12 peptides |
24 spectra |
|
0.000 0.000 | 0.000 |
0.000 0.000 | 0.000 |
0.000 0.000 | 0.000 |
0.103 0.079 | 0.121 |
0.499 0.470 | 0.524 |
0.000 0.000 | 0.000 |
0.358 0.341 | 0.374 |
0.040 0.030 | 0.049 |
| 2 spectra, LSLEEETMWLR | 0.000 | 0.000 | 0.000 | 0.096 | 0.580 | 0.000 | 0.272 | 0.053 | ||
| 2 spectra, IPEFIAFR | 0.000 | 0.000 | 0.000 | 0.131 | 0.542 | 0.000 | 0.189 | 0.138 | ||
| 4 spectra, GLQQHLCVVQLTR | 0.000 | 0.000 | 0.000 | 0.117 | 0.605 | 0.000 | 0.257 | 0.021 | ||
| 1 spectrum, DLDVFFSWDPK | 0.041 | 0.000 | 0.000 | 0.000 | 0.656 | 0.000 | 0.270 | 0.033 | ||
| 1 spectrum, LGDPEELMFQYFK | 0.061 | 0.000 | 0.000 | 0.194 | 0.376 | 0.000 | 0.369 | 0.000 | ||
| 2 spectra, YQEALDVIR | 0.000 | 0.000 | 0.000 | 0.124 | 0.556 | 0.000 | 0.199 | 0.122 | ||
| 2 spectra, LISALPSLTHPVEPR | 0.000 | 0.000 | 0.112 | 0.035 | 0.468 | 0.000 | 0.386 | 0.000 | ||
| 2 spectra, TMFLPLAER | 0.000 | 0.000 | 0.000 | 0.111 | 0.680 | 0.000 | 0.126 | 0.083 | ||
| 2 spectra, SQGCNDEFR | 0.024 | 0.000 | 0.000 | 0.353 | 0.284 | 0.000 | 0.284 | 0.055 | ||
| 3 spectra, GDLLEVK | 0.081 | 0.000 | 0.013 | 0.113 | 0.541 | 0.000 | 0.252 | 0.000 | ||
| 1 spectrum, LNNSLHFAQVR | 0.000 | 0.000 | 0.006 | 0.057 | 0.156 | 0.130 | 0.651 | 0.000 | ||
| 2 spectra, ALGLQR | 0.000 | 0.000 | 0.000 | 0.000 | 0.053 | 0.000 | 0.901 | 0.046 |
| Plot | Mito | Lyso or Perox | ER | Golgi | PM | Cytosol | Nucleus | ||||||
| Expt B |
2 peptides |
3 spectra |
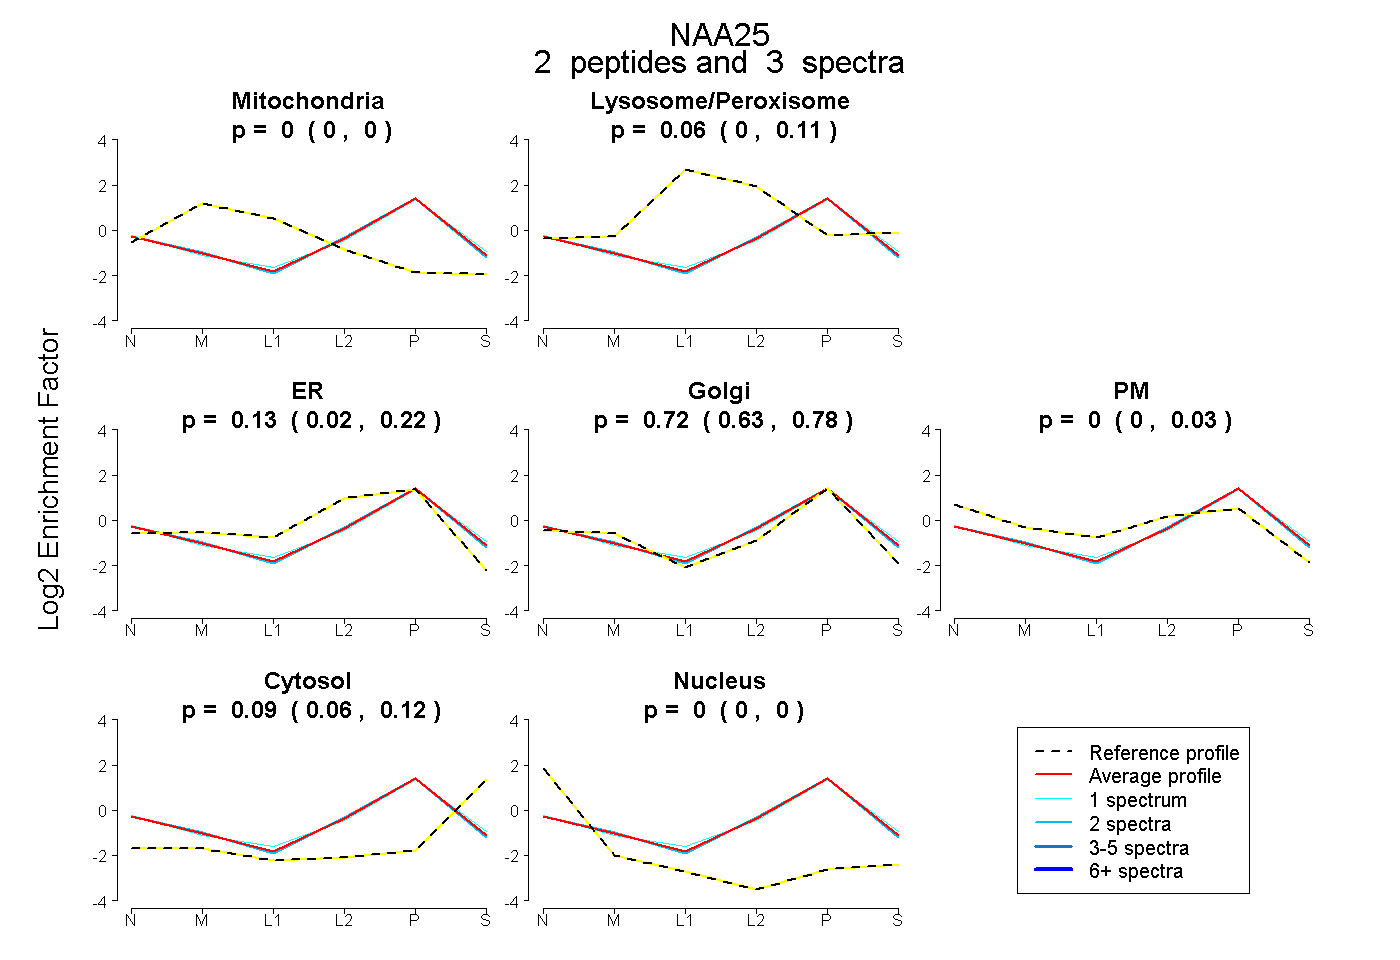 |
0.000 0.000 | 0.000 |
0.056 0.000 | 0.107 |
0.135 0.023 | 0.218 |
0.717 0.629 | 0.783 |
0.000 0.000 | 0.035 |
0.092 0.062 | 0.119 |
0.000 0.000 | 0.000 |
|||
| Plot | Lyso | Other | |||||||||||
| Expt C |
6 peptides |
7 spectra |
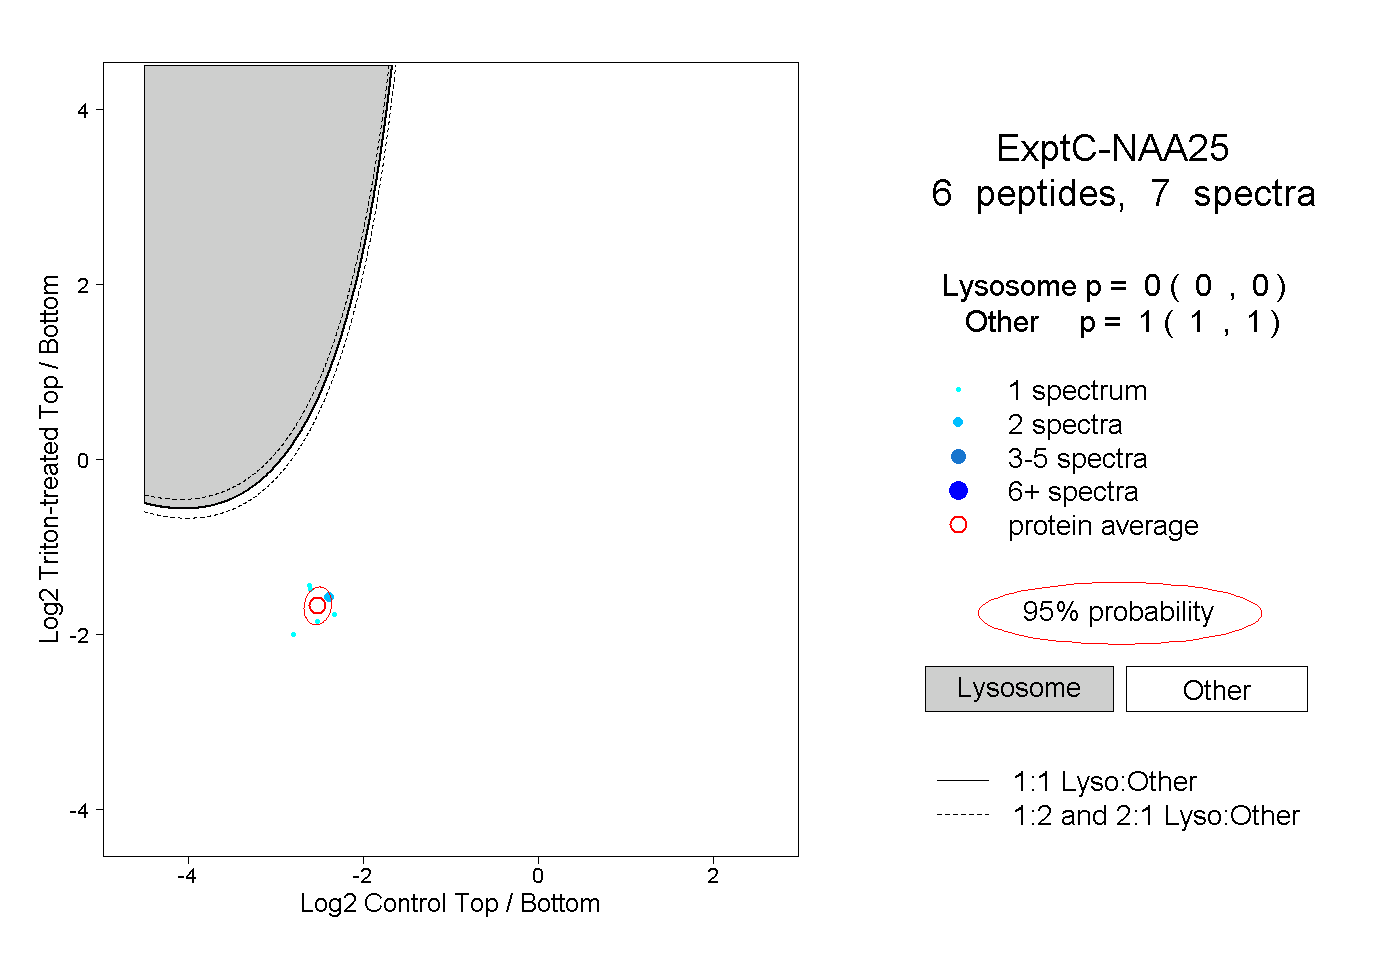 |
0.000 0.000 | 0.000 |
1.000 1.000 | 1.000 |