 5
5peptides
spectra
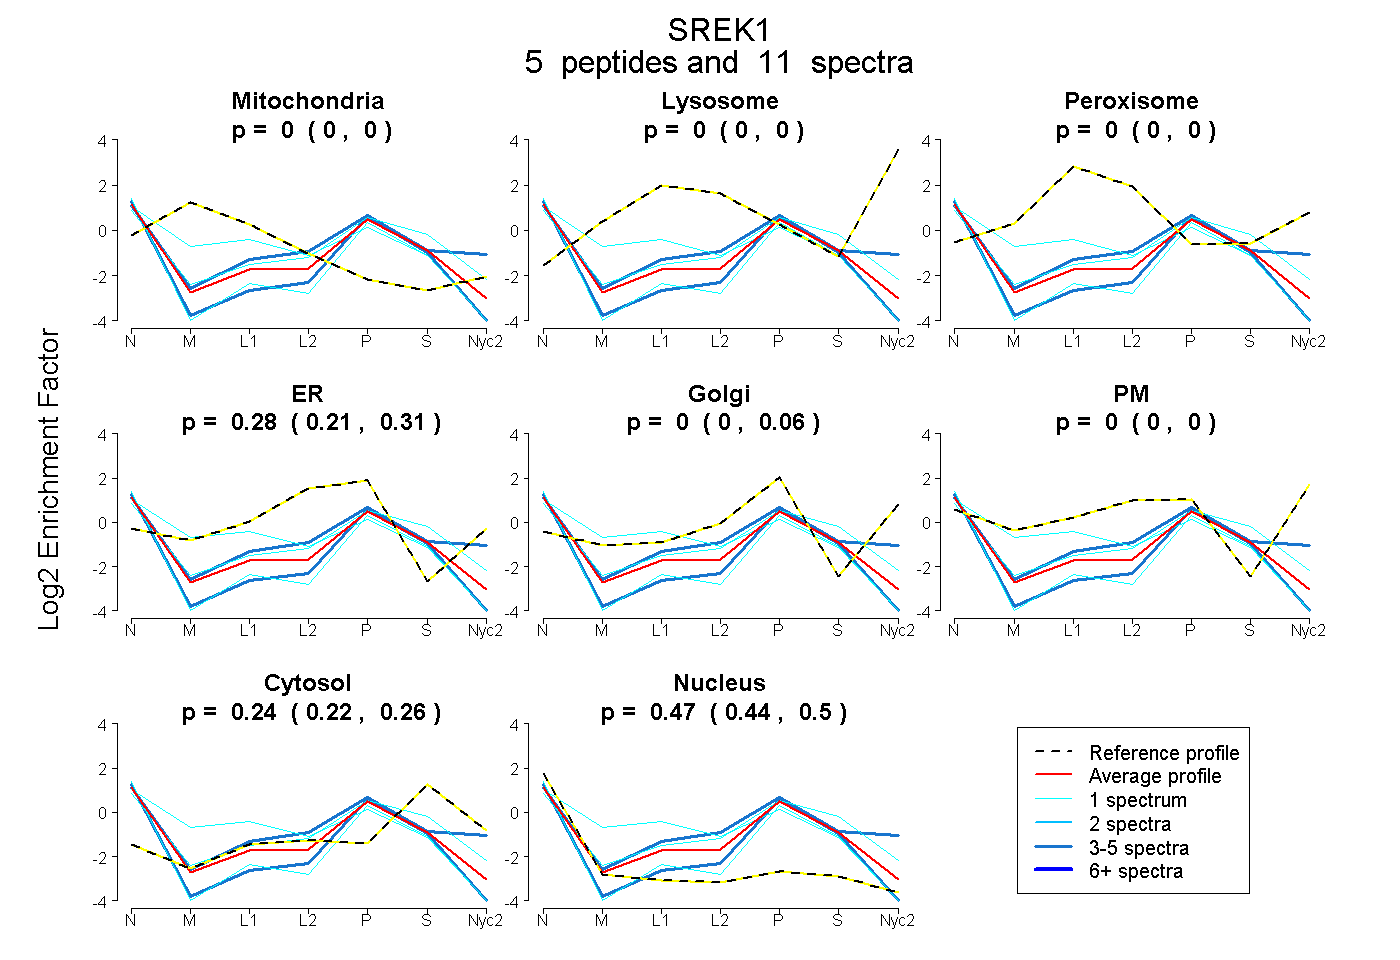
0.000 | 0.000
0.000 | 0.000
0.000 | 0.000
0.209 | 0.309
0.000 | 0.063
0.000 | 0.000
0.218 | 0.257
0.441 | 0.501
1peptide
spectra
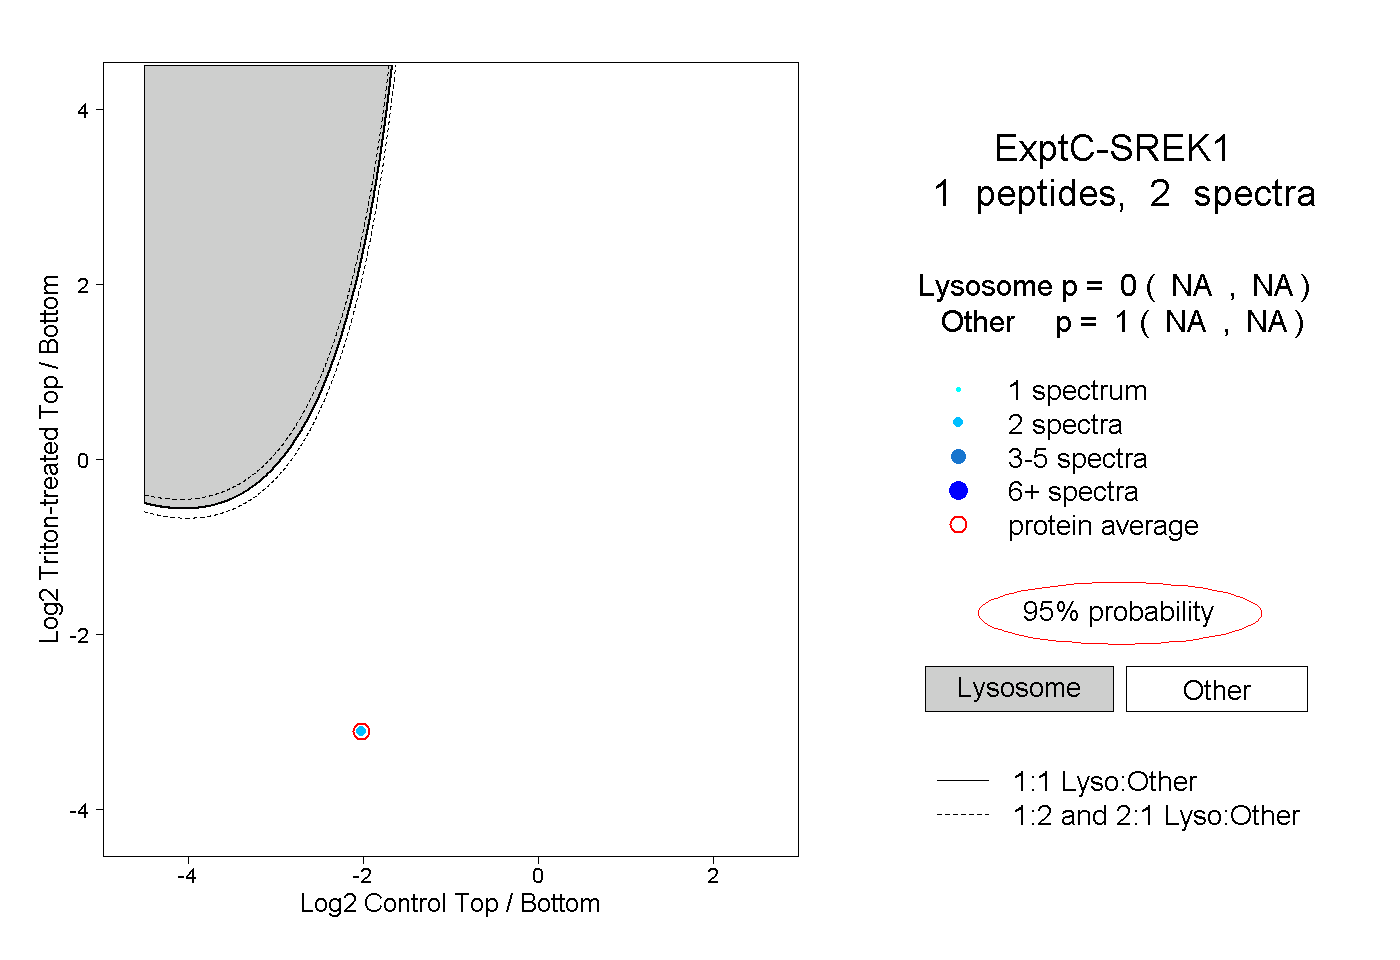
NA | NA
NA | NA
| Plot | Mito | Lyso | Perox | ER | Golgi | PM | Cytosol | Nucleus | |||||
| Expt A |
5 peptides |
11 spectra |
|
0.000 0.000 | 0.000 |
0.000 0.000 | 0.000 |
0.000 0.000 | 0.000 |
0.284 0.209 | 0.309 |
0.000 0.000 | 0.063 |
0.000 0.000 | 0.000 |
0.241 0.218 | 0.257 |
0.475 0.441 | 0.501 |
||
| Plot | Lyso | Other | |||||||||||
| Expt C |
1 peptide |
2 spectra |
|
0.000 NA | NA |
1.000 NA | NA |