 5
5peptides
spectra
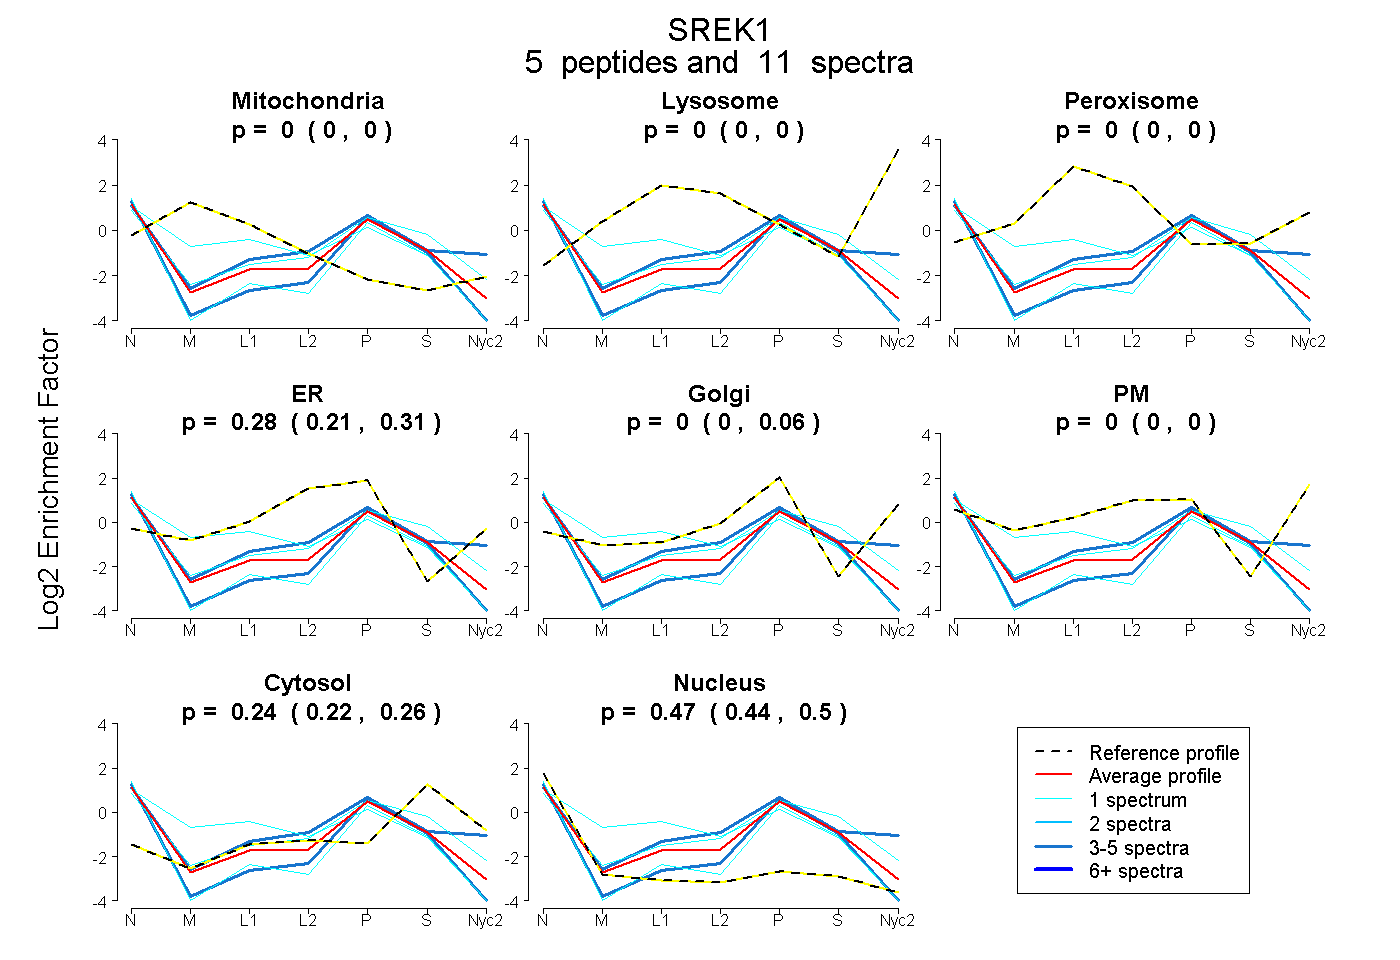
0.000 | 0.000
0.000 | 0.000
0.000 | 0.000
0.209 | 0.309
0.000 | 0.063
0.000 | 0.000
0.218 | 0.257
0.441 | 0.501
| Plot | Mito | Lyso | Perox | ER | Golgi | PM | Cytosol | Nucleus | |||||
| Expt A |
5 peptides |
11 spectra |
|
0.000 0.000 | 0.000 |
0.000 0.000 | 0.000 |
0.000 0.000 | 0.000 |
0.284 0.209 | 0.309 |
0.000 0.000 | 0.063 |
0.000 0.000 | 0.000 |
0.241 0.218 | 0.257 |
0.475 0.441 | 0.501 |
| 1 spectrum, TVYVGNLNSQTTTADQLLEFFK | 0.268 | 0.000 | 0.000 | 0.302 | 0.000 | 0.000 | 0.083 | 0.347 | ||
| 5 spectra, ELEEVMK | 0.000 | 0.000 | 0.000 | 0.144 | 0.000 | 0.000 | 0.216 | 0.640 | ||
| 1 spectrum, MAGDETQPTR | 0.000 | 0.000 | 0.000 | 0.306 | 0.000 | 0.000 | 0.400 | 0.293 | ||
| 3 spectra, ALAFNGVMFGDRPLK | 0.000 | 0.000 | 0.000 | 0.148 | 0.323 | 0.006 | 0.262 | 0.261 | ||
| 1 spectrum, FAFVEFADQNSVPR | 0.000 | 0.000 | 0.000 | 0.071 | 0.034 | 0.000 | 0.209 | 0.686 |
| Plot | Lyso | Other | |||||||||||
| Expt C |
1 peptide |
2 spectra |
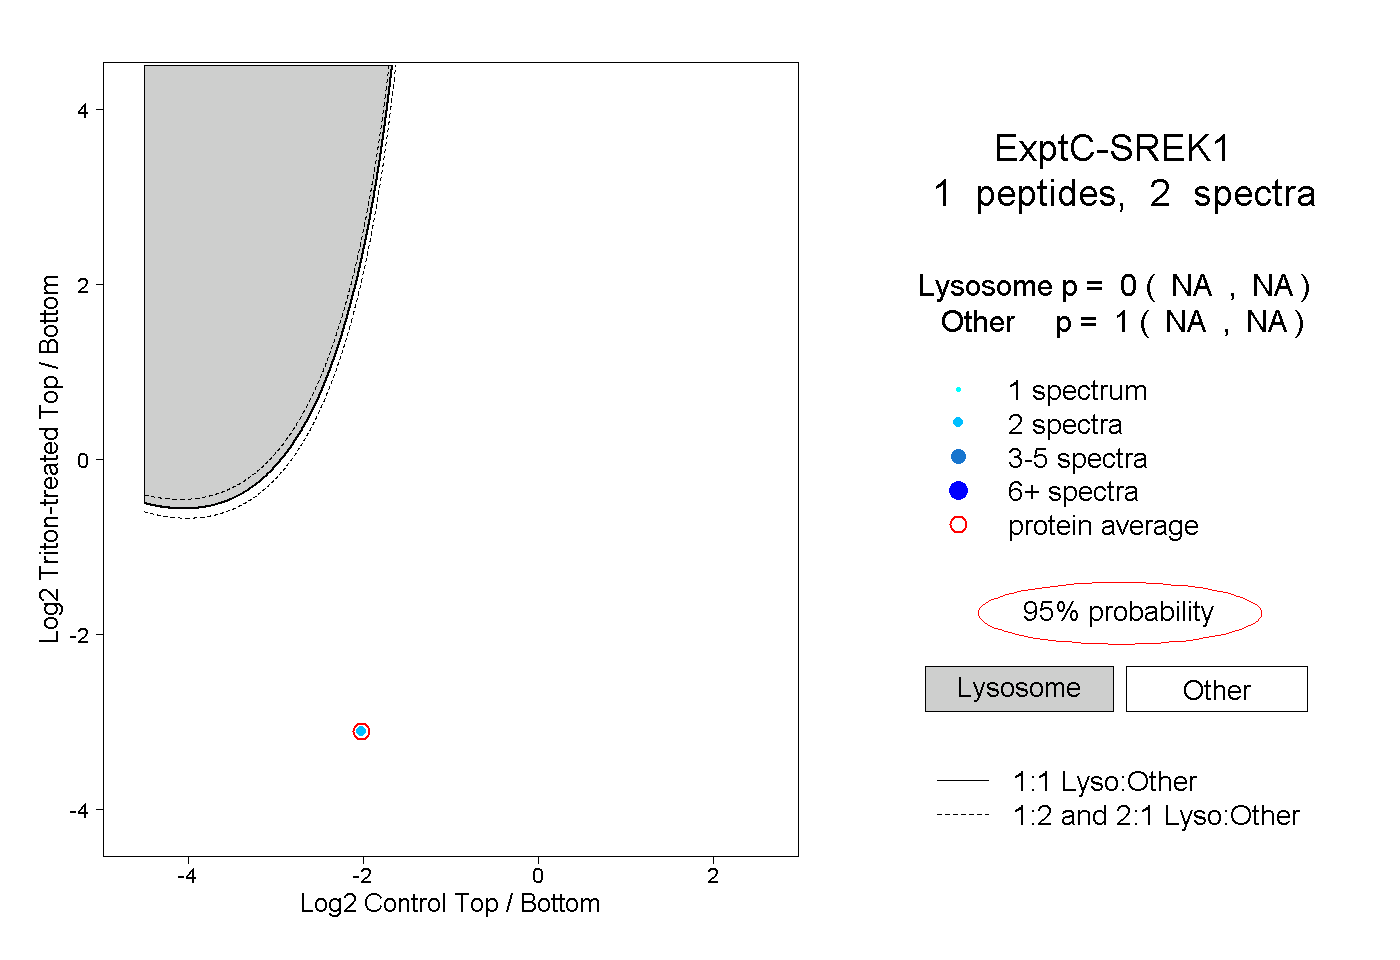 |
0.000 NA | NA |
1.000 NA | NA |