 7
7peptides
spectra
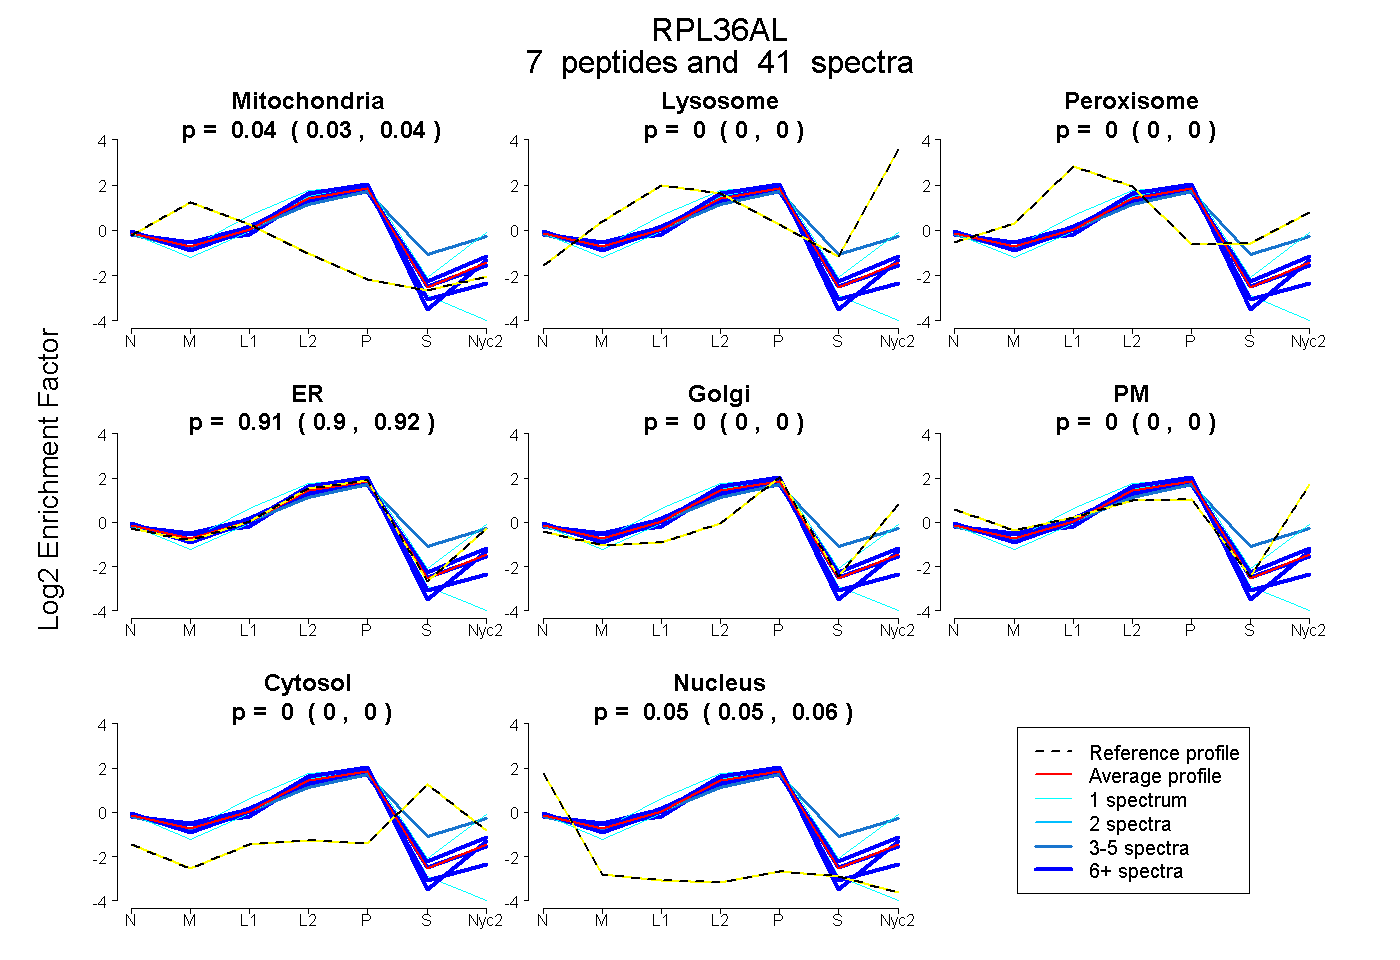
0.031 | 0.041
0.000 | 0.000
0.000 | 0.000
0.905 | 0.917
0.000 | 0.000
0.000 | 0.000
0.000 | 0.000
0.047 | 0.056
4peptides
spectra
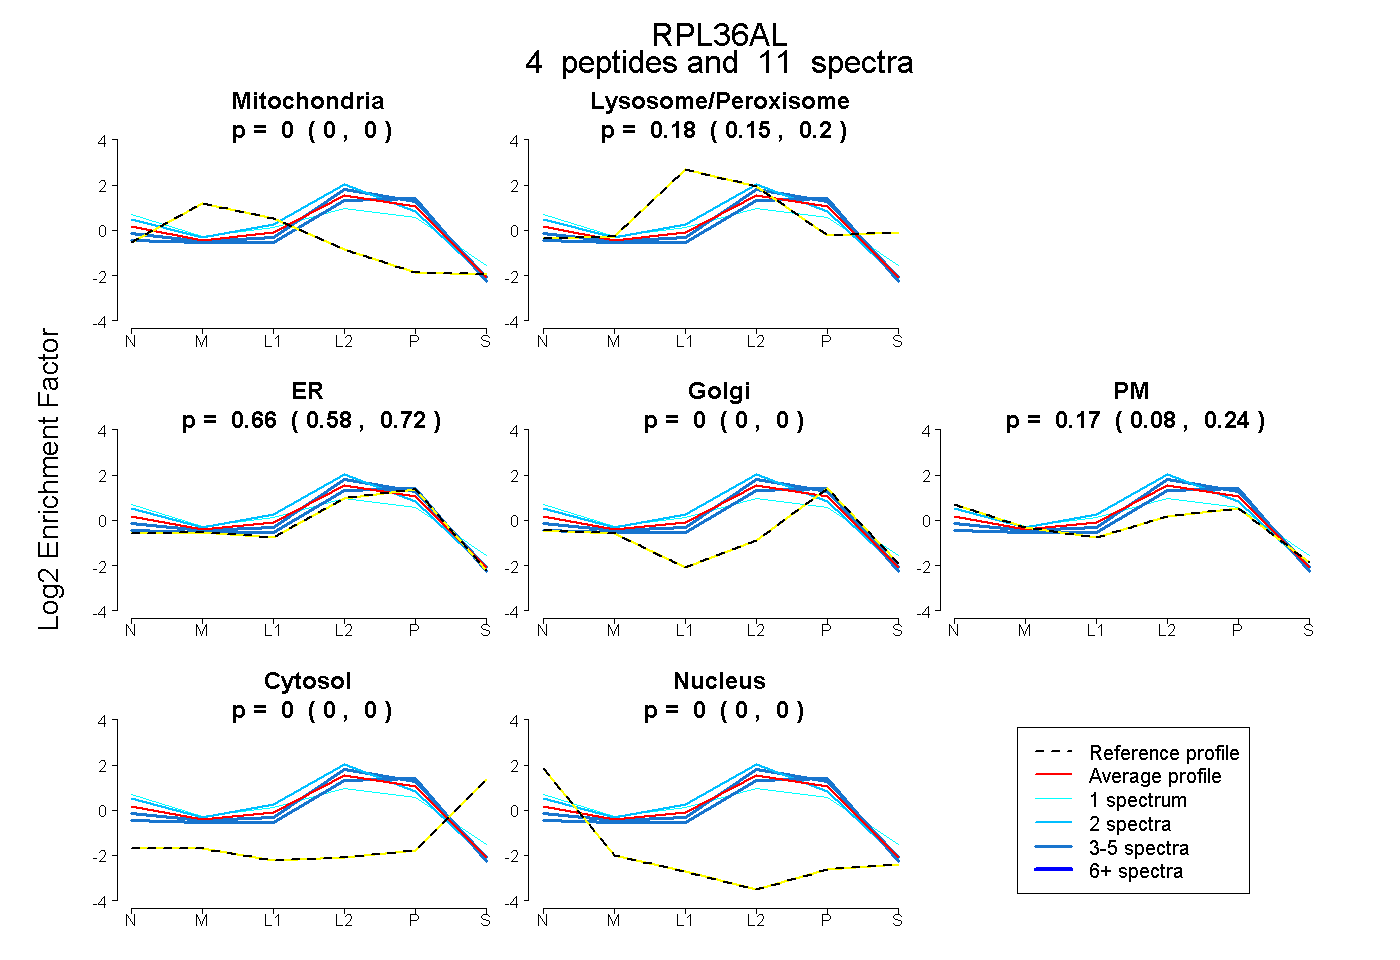
0.000 | 0.000
0.149 | 0.198
0.577 | 0.719
0.000 | 0.000
0.085 | 0.238
0.000 | 0.000
0.000 | 0.000
7peptides
spectra
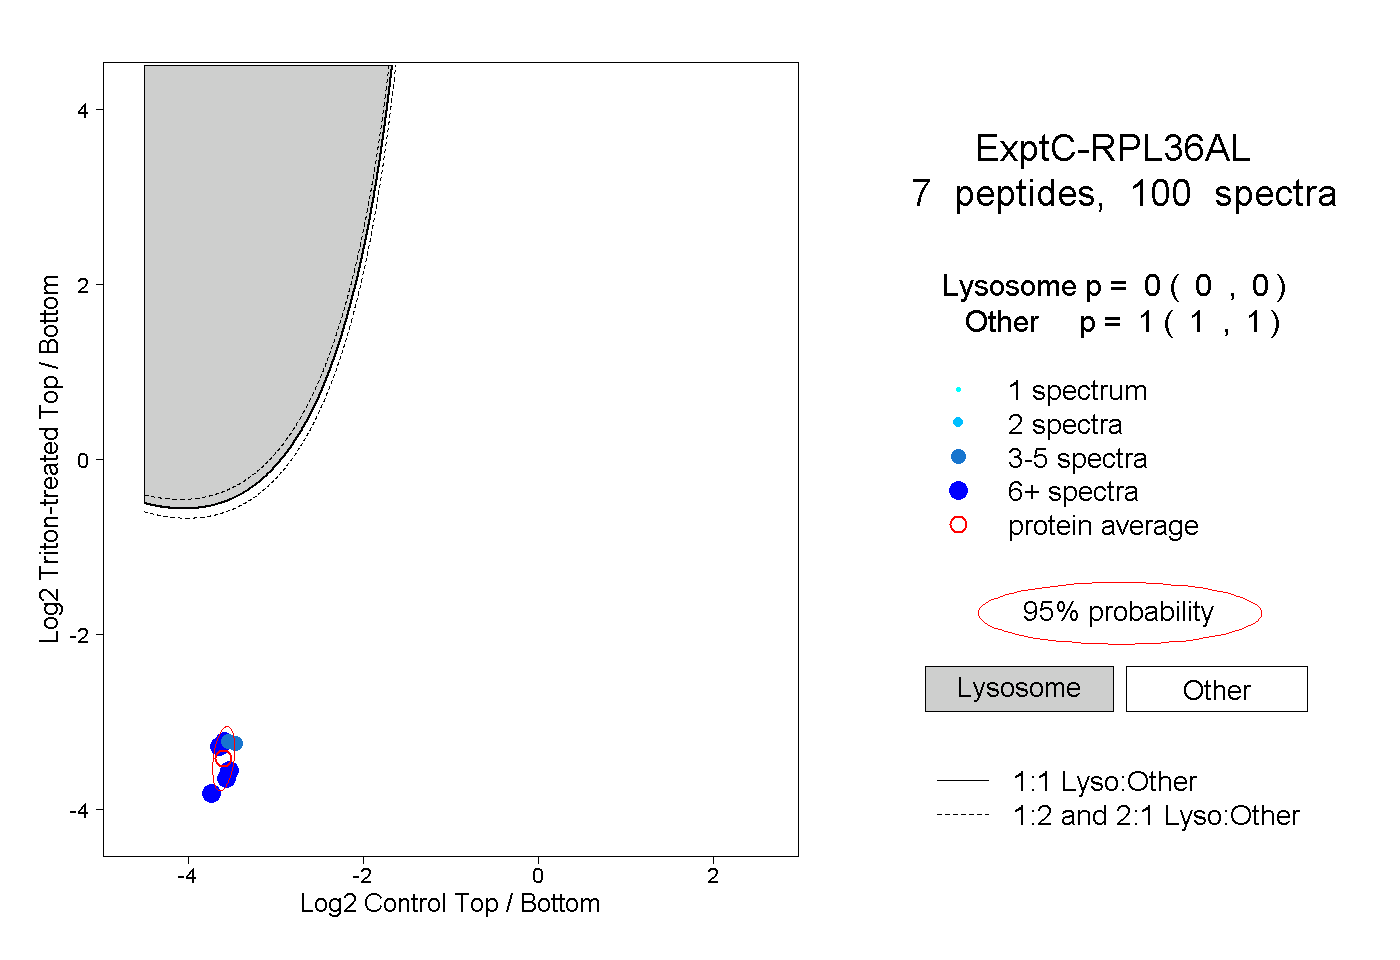
0.000 | 0.000
1.000 | 1.000
4peptides
spectra
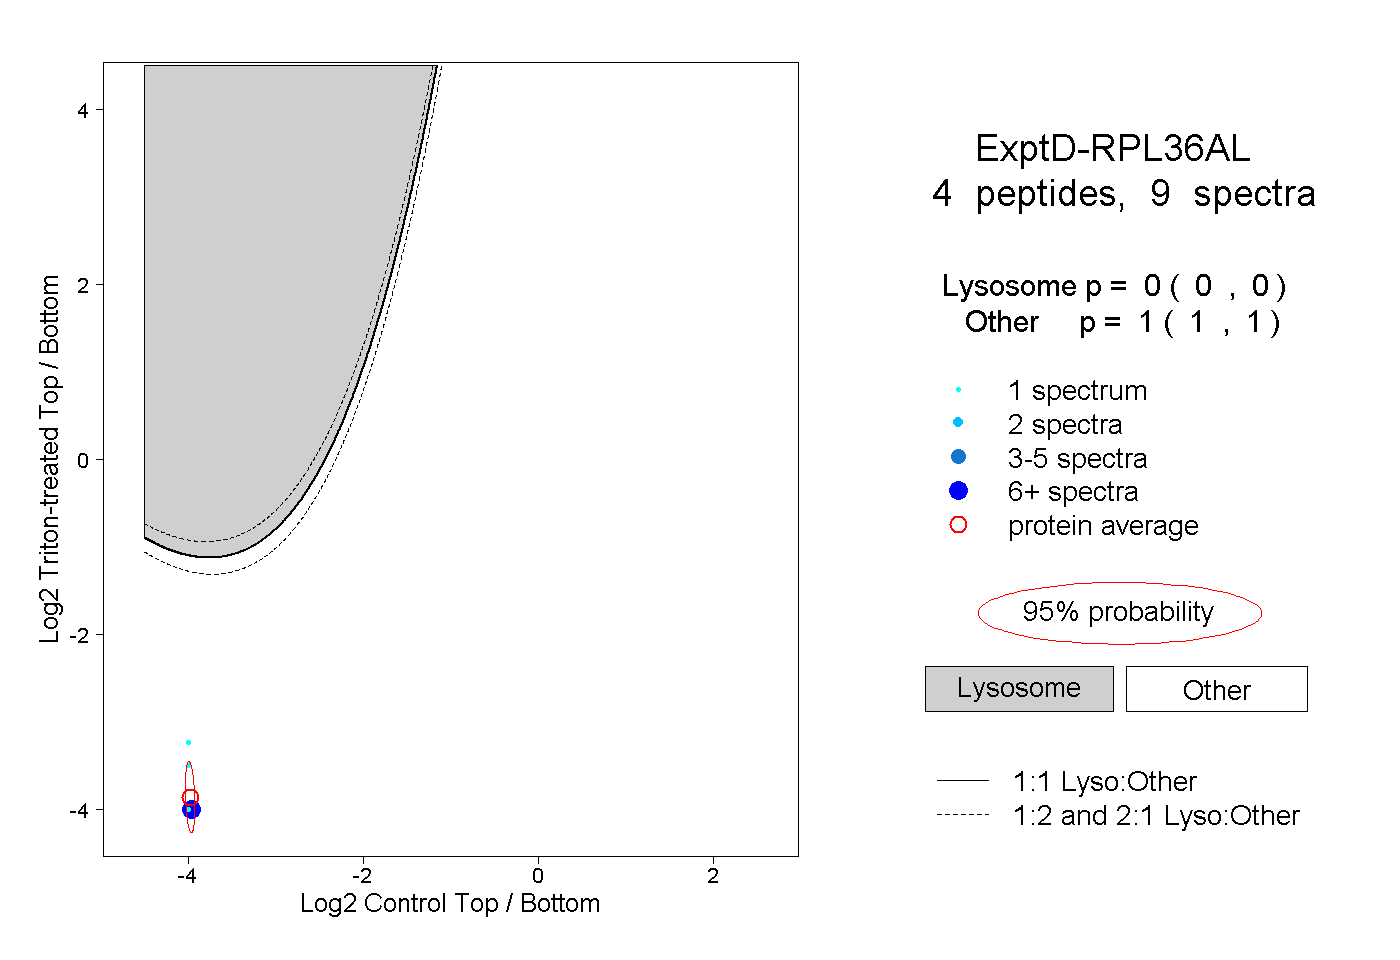
0.000 | 0.000
1.000 | 1.000