 9
9peptides
spectra
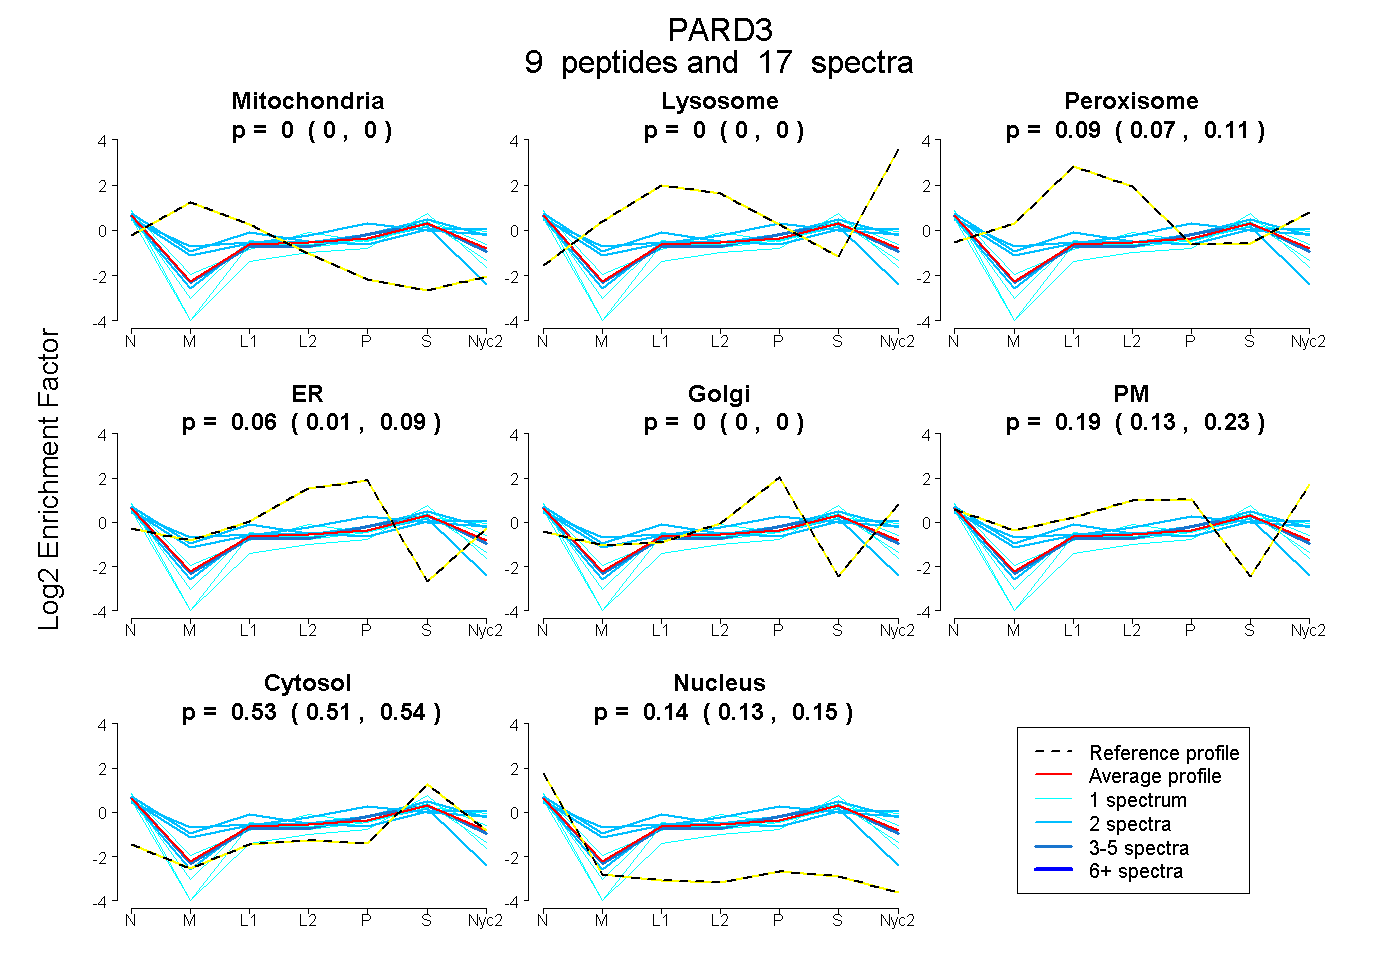
0.000 | 0.000
0.000 | 0.000
0.068 | 0.113
0.012 | 0.088
0.000 | 0.000
0.132 | 0.232
0.507 | 0.541
0.128 | 0.153
3peptides
spectra
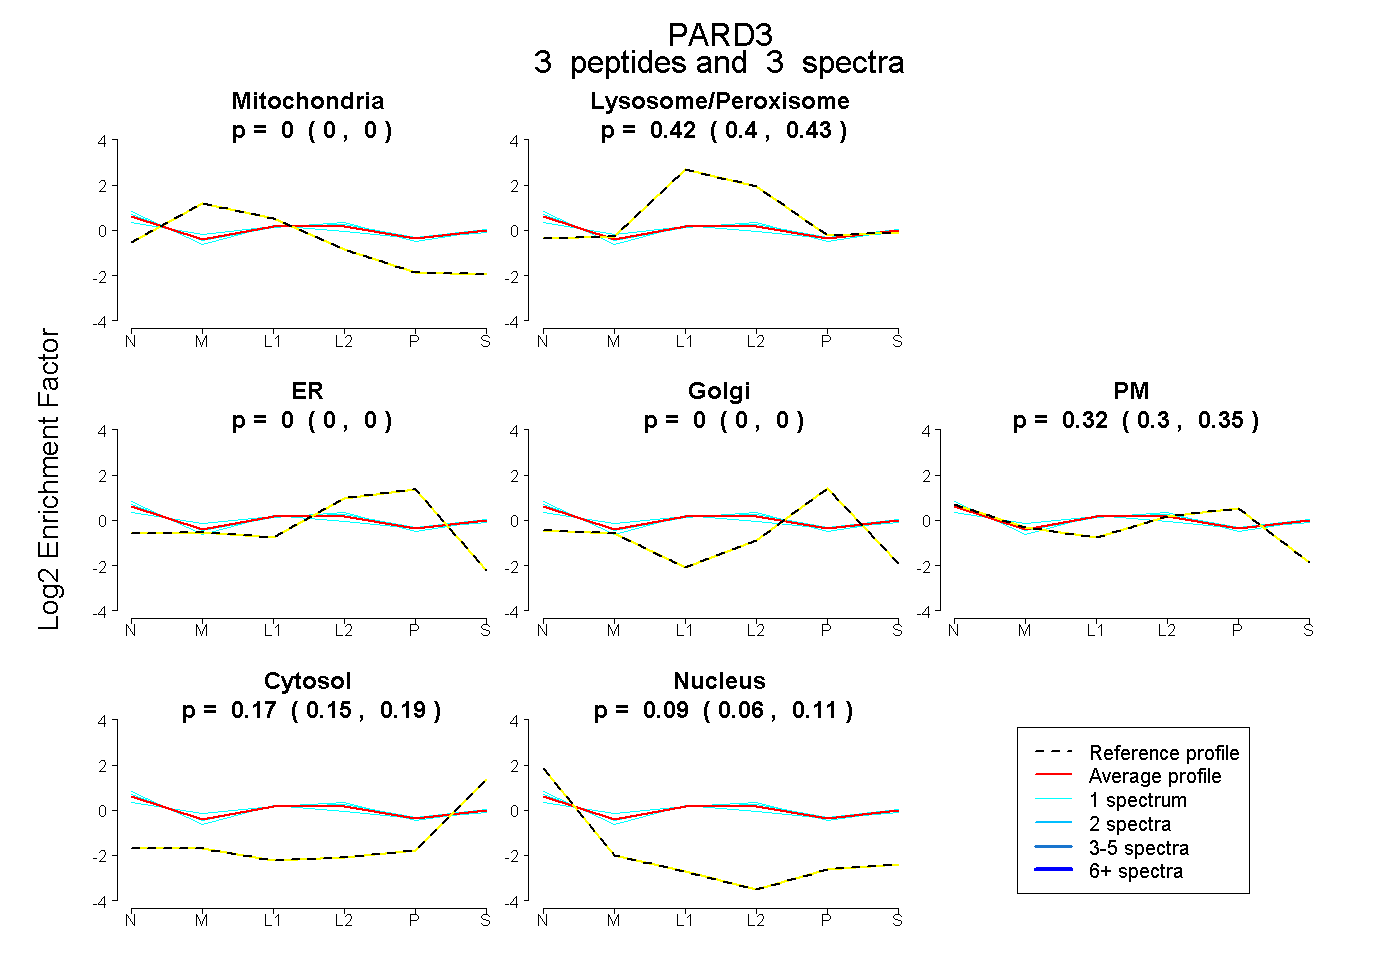
0.000 | 0.000
0.404 | 0.430
0.000 | 0.000
0.000 | 0.000
0.296 | 0.346
0.148 | 0.195
0.059 | 0.110
5peptides
spectra
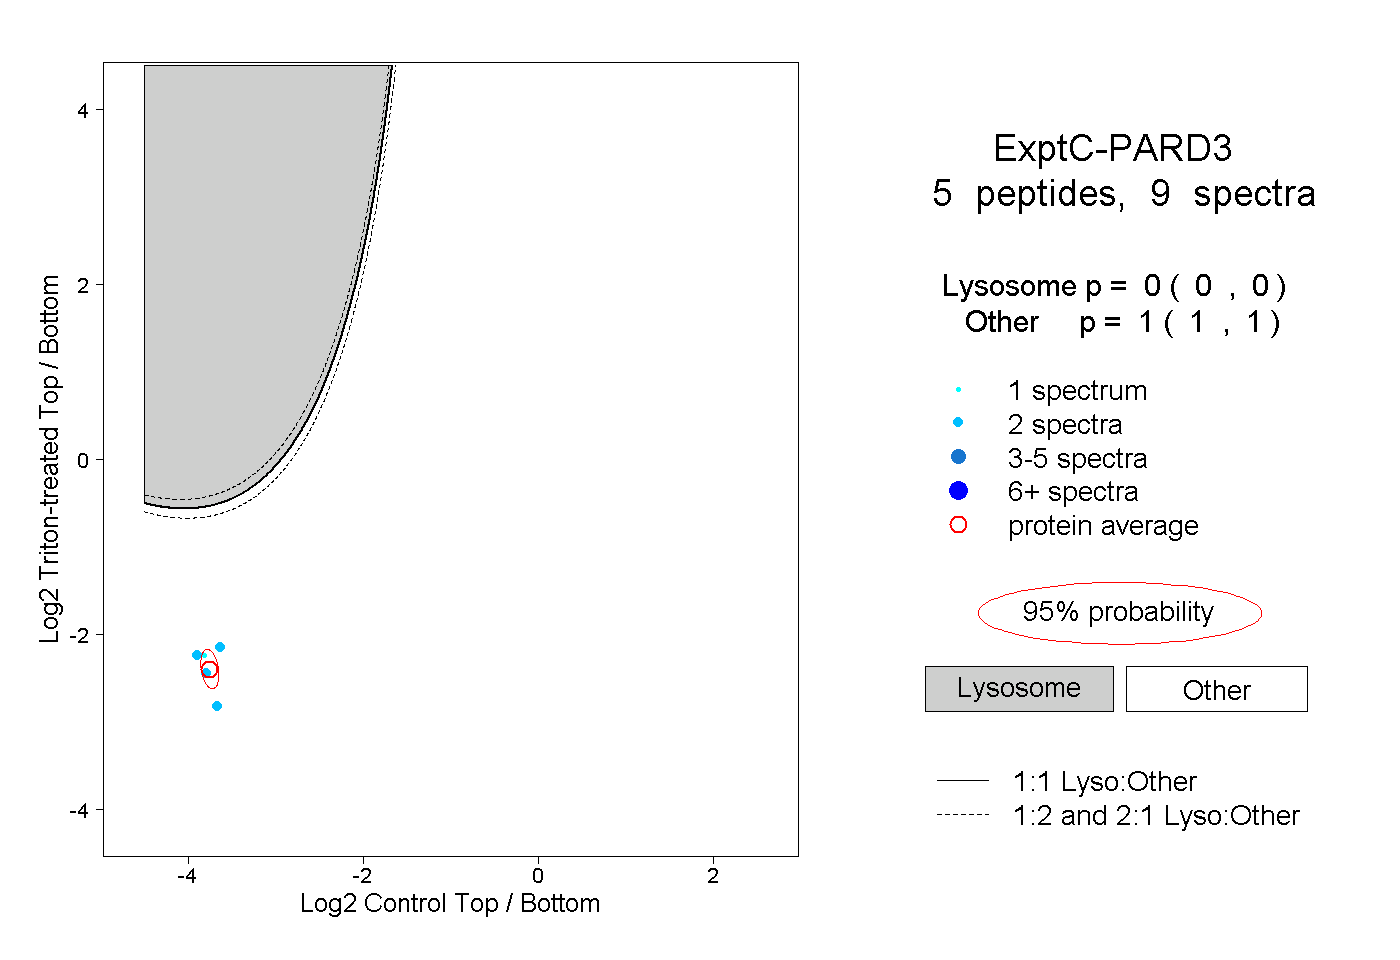
0.000 | 0.000
1.000 | 1.000