 9
9peptides
spectra
0.000 | 0.000
0.000 | 0.000
0.068 | 0.113
0.012 | 0.088
0.000 | 0.000
0.132 | 0.232
0.507 | 0.541
0.128 | 0.153
| Plot | Mito | Lyso | Perox | ER | Golgi | PM | Cytosol | Nucleus | |||||
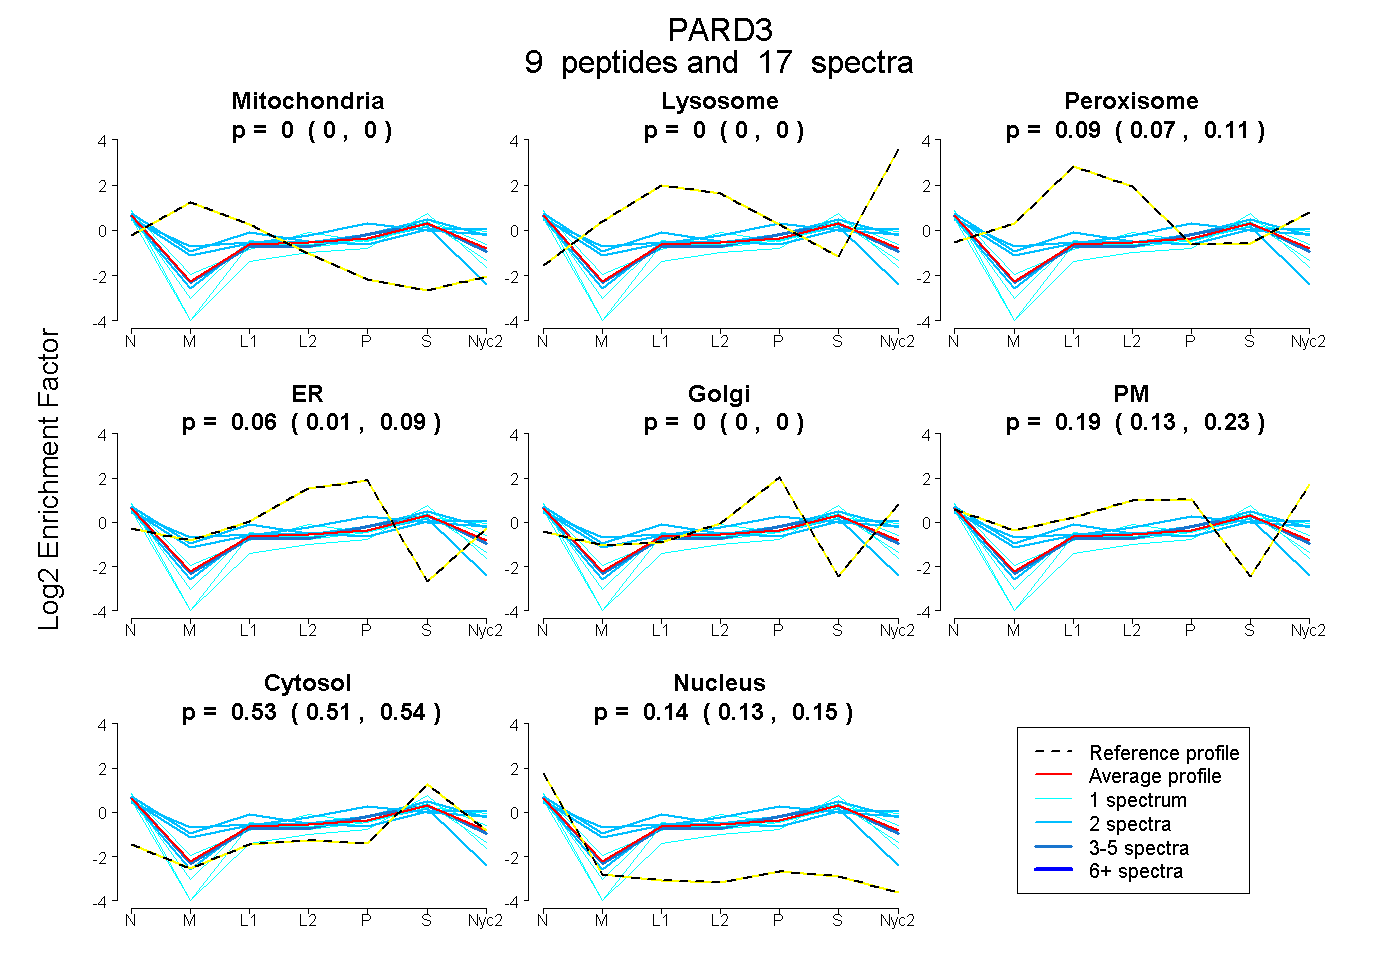
| Expt A |
9 peptides |
17 spectra |
|
0.000 0.000 | 0.000 |
0.000 0.000 | 0.000 |
0.093 0.068 | 0.113 |
0.055 0.012 | 0.088 |
0.000 0.000 | 0.000 |
0.185 0.132 | 0.232 |
0.525 0.507 | 0.541 |
0.142 0.128 | 0.153 |
| 2 spectra, EQYEQLSQR | 0.000 | 0.000 | 0.006 | 0.000 | 0.000 | 0.326 | 0.622 | 0.046 | ||
| 1 spectrum, DVTIGGSAPIYVK | 0.000 | 0.000 | 0.054 | 0.000 | 0.000 | 0.217 | 0.611 | 0.119 | ||
| 1 spectrum, SPGSPAAPELPIETELDDR | 0.000 | 0.000 | 0.000 | 0.069 | 0.000 | 0.000 | 0.717 | 0.214 | ||
| 2 spectra, AEQENLFHENDCIVR | 0.179 | 0.000 | 0.120 | 0.160 | 0.000 | 0.000 | 0.384 | 0.157 | ||
| 1 spectrum, ANQEAMETLR | 0.000 | 0.000 | 0.040 | 0.000 | 0.000 | 0.373 | 0.505 | 0.082 | ||
| 1 spectrum, LVQVPNDGGPLGIHVVPFSAR | 0.000 | 0.000 | 0.008 | 0.199 | 0.000 | 0.000 | 0.612 | 0.181 | ||
| 2 spectra, SQEEVVSLLR | 0.000 | 0.000 | 0.251 | 0.000 | 0.000 | 0.260 | 0.362 | 0.127 | ||
| 5 spectra, GMIQLIVAR | 0.000 | 0.000 | 0.048 | 0.106 | 0.000 | 0.160 | 0.543 | 0.142 | ||
| 2 spectra, QEEAFHPR | 0.000 | 0.000 | 0.046 | 0.054 | 0.000 | 0.403 | 0.443 | 0.054 |
| Plot | Mito | Lyso or Perox | ER | Golgi | PM | Cytosol | Nucleus | ||||||
| Expt B |
3 peptides |
3 spectra |
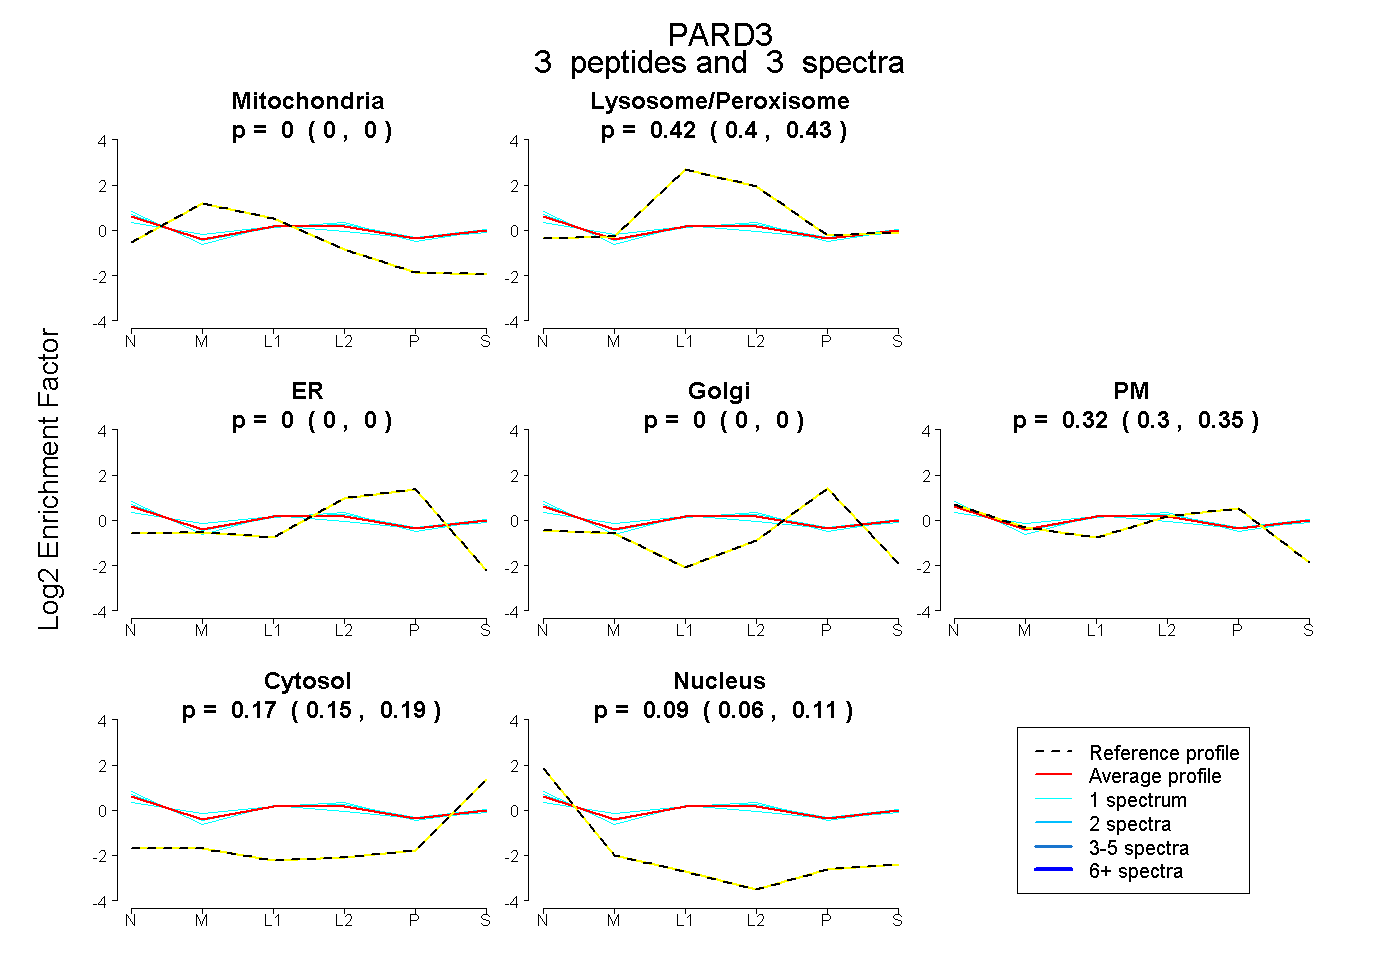 |
0.000 0.000 | 0.000 |
0.418 0.404 | 0.430 |
0.000 0.000 | 0.000 |
0.000 0.000 | 0.000 |
0.323 0.296 | 0.346 |
0.172 0.148 | 0.195 |
0.087 0.059 | 0.110 |
|||
| Plot | Lyso | Other | |||||||||||
| Expt C |
5 peptides |
9 spectra |
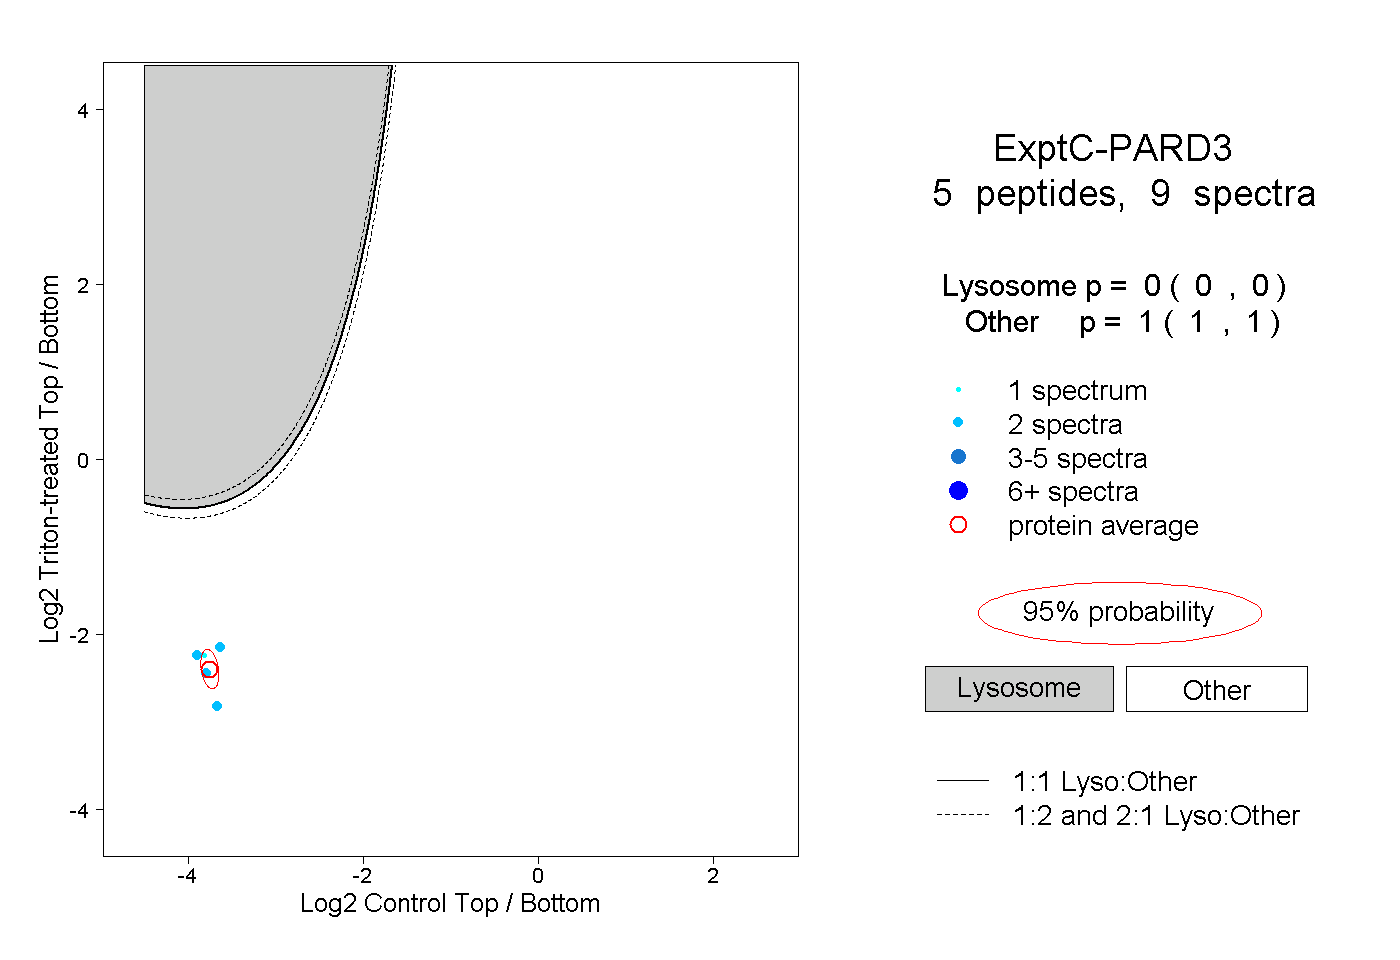 |
0.000 0.000 | 0.000 |
1.000 1.000 | 1.000 |