 11
11peptides
spectra
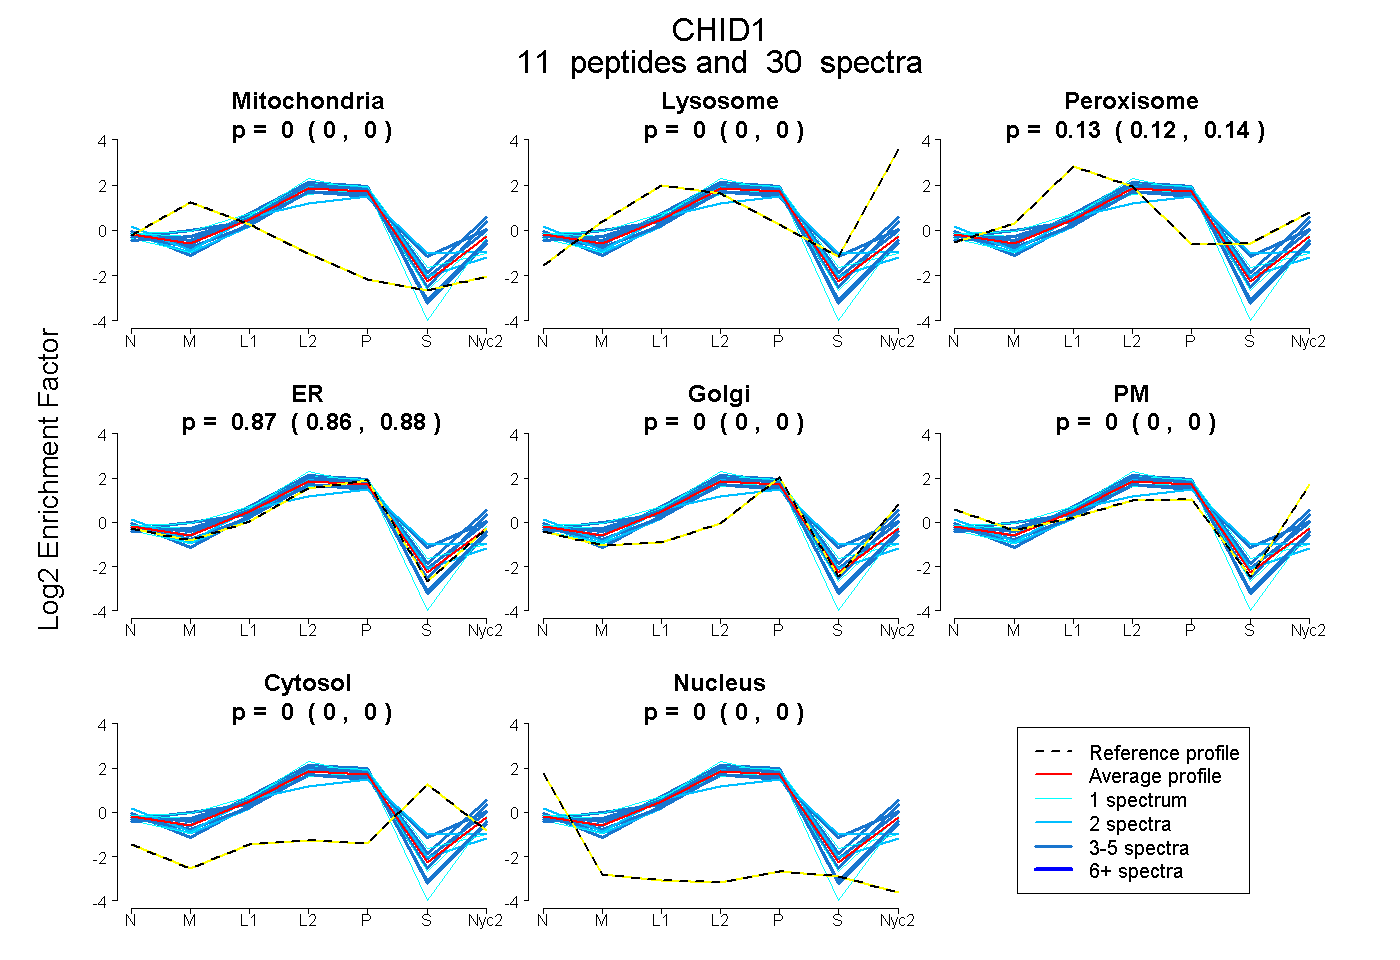
0.000 | 0.000
0.000 | 0.000
0.120 | 0.141
0.857 | 0.878
0.000 | 0.000
0.000 | 0.000
0.000 | 0.000
0.000 | 0.000
3peptides
spectra
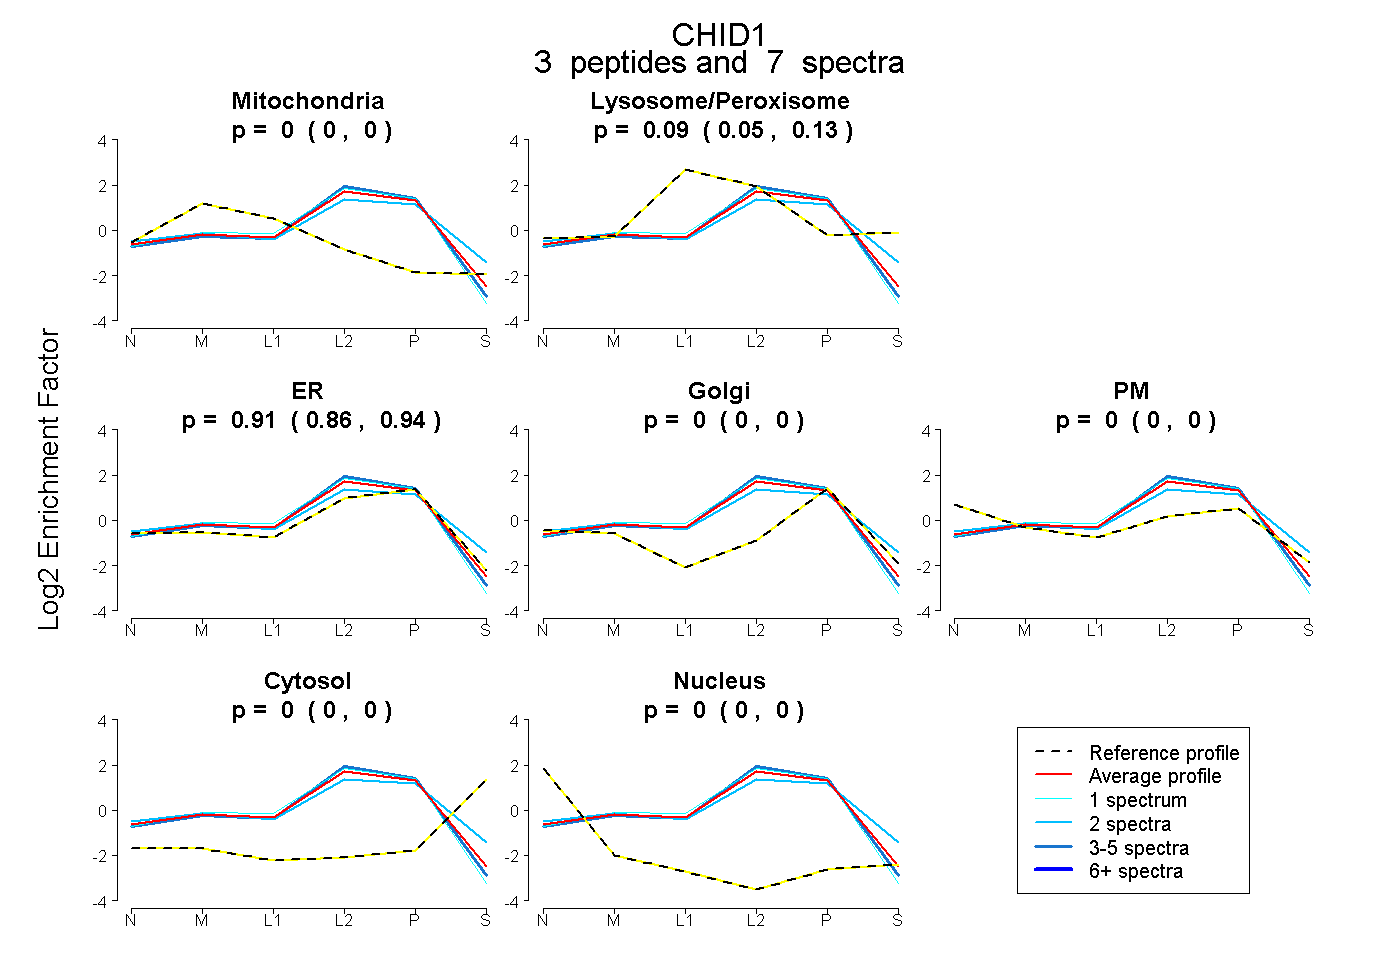
0.000 | 0.000
0.049 | 0.128
0.861 | 0.943
0.000 | 0.000
0.000 | 0.000
0.000 | 0.000
0.000 | 0.000
10peptides
spectra
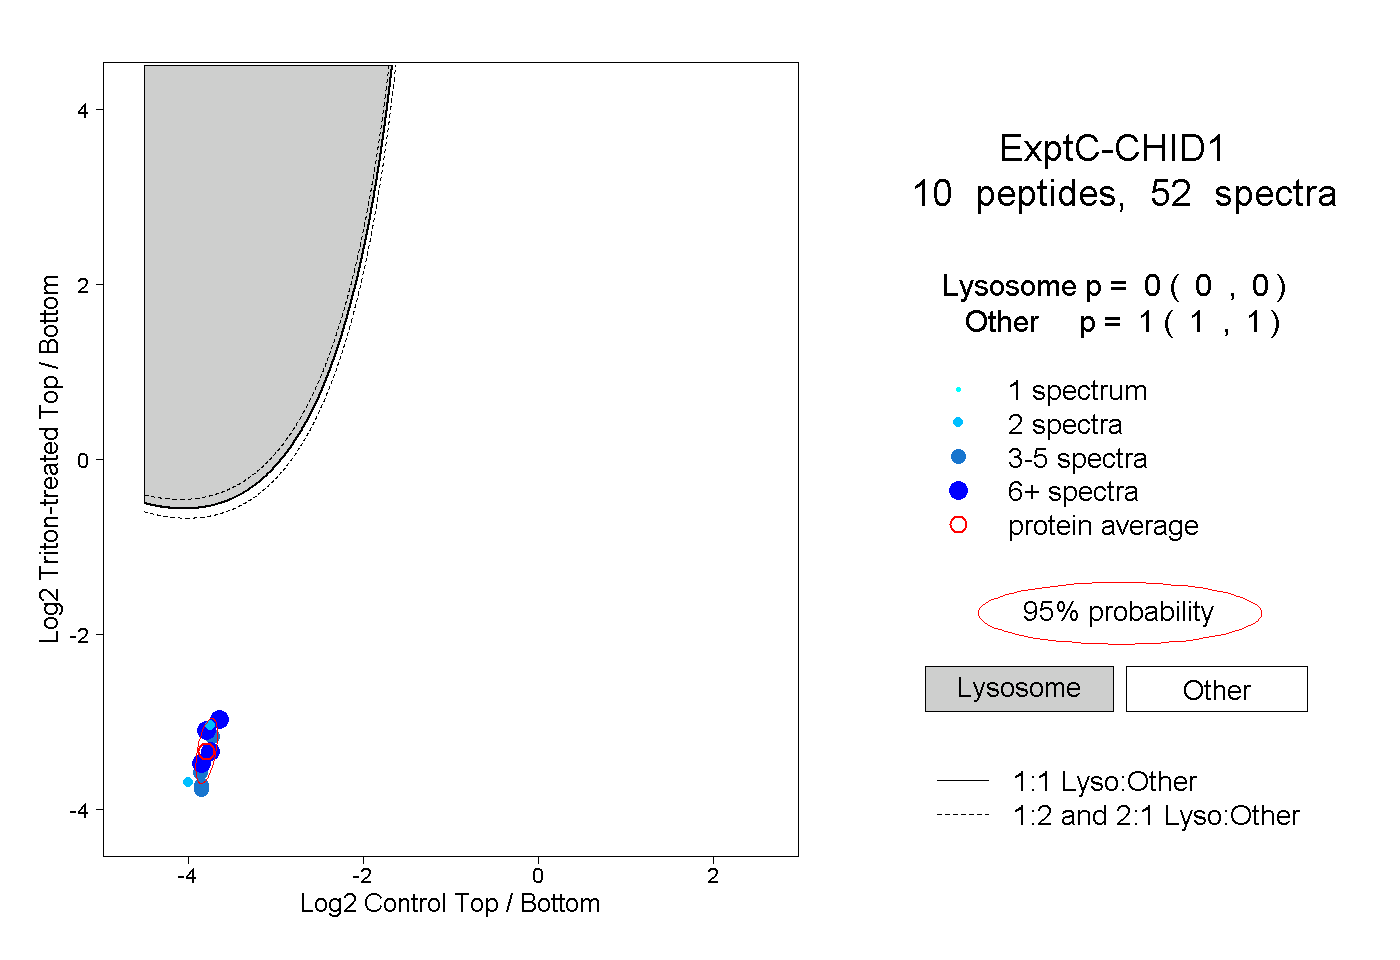
0.000 | 0.000
1.000 | 1.000
1peptide
spectra
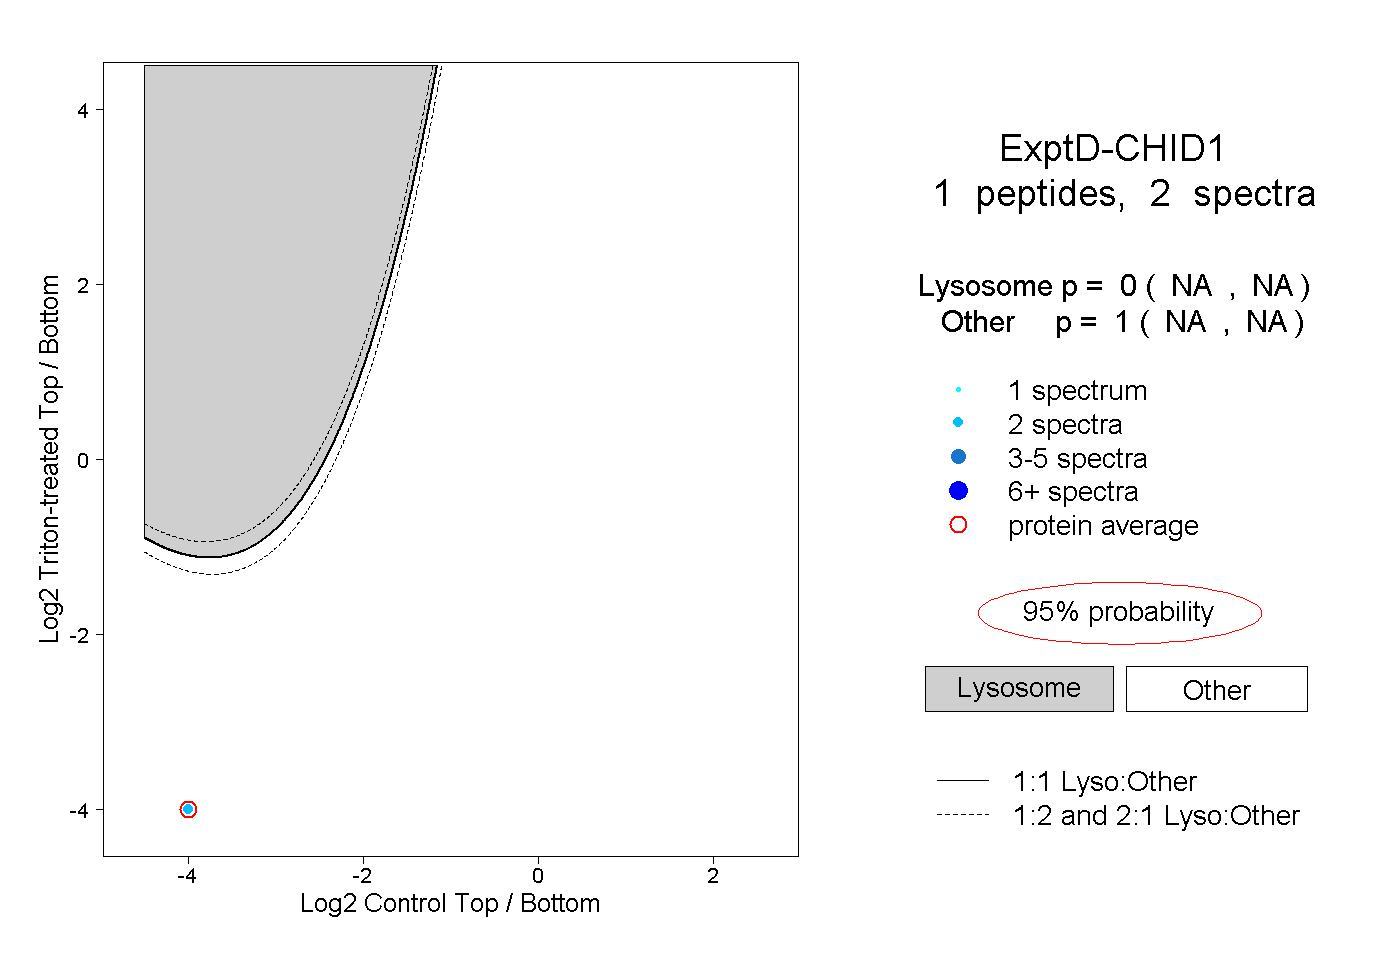
NA | NA
NA | NA