 11
11peptides
spectra
0.000 | 0.000
0.000 | 0.000
0.120 | 0.141
0.857 | 0.878
0.000 | 0.000
0.000 | 0.000
0.000 | 0.000
0.000 | 0.000
| Plot | Mito | Lyso | Perox | ER | Golgi | PM | Cytosol | Nucleus | |||||
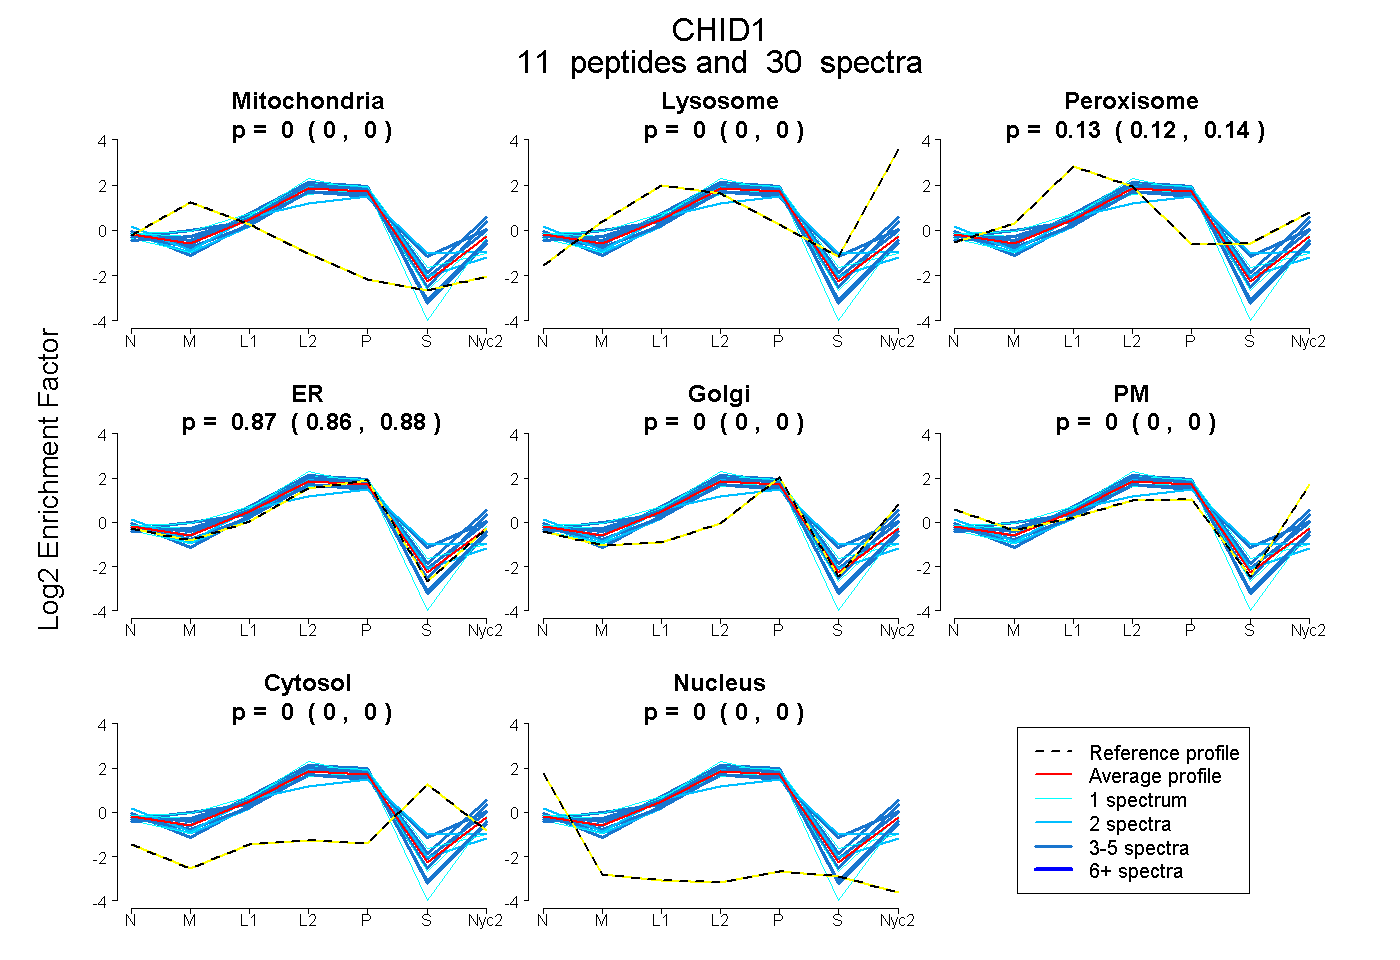
| Expt A |
11 peptides |
30 spectra |
|
0.000 0.000 | 0.000 |
0.000 0.000 | 0.000 |
0.131 0.120 | 0.141 |
0.869 0.857 | 0.878 |
0.000 0.000 | 0.000 |
0.000 0.000 | 0.000 |
0.000 0.000 | 0.000 |
0.000 0.000 | 0.000 |
| 1 spectrum, SYCSAR | 0.070 | 0.000 | 0.000 | 0.920 | 0.000 | 0.010 | 0.000 | 0.000 | ||
| 3 spectra, EMFEITGLHDVDQGWMR | 0.027 | 0.056 | 0.133 | 0.783 | 0.000 | 0.000 | 0.000 | 0.000 | ||
| 5 spectra, AEDVVLEHR | 0.000 | 0.113 | 0.019 | 0.754 | 0.000 | 0.098 | 0.016 | 0.000 | ||
| 4 spectra, EPVIGAR | 0.000 | 0.000 | 0.031 | 0.969 | 0.000 | 0.000 | 0.000 | 0.000 | ||
| 2 spectra, FTQISPVWLQLK | 0.000 | 0.000 | 0.011 | 0.950 | 0.000 | 0.000 | 0.039 | 0.000 | ||
| 1 spectrum, LLFEDWTYDDFR | 0.000 | 0.000 | 0.133 | 0.840 | 0.000 | 0.000 | 0.026 | 0.000 | ||
| 5 spectra, HVVFYPTLK | 0.000 | 0.055 | 0.084 | 0.703 | 0.000 | 0.158 | 0.000 | 0.000 | ||
| 2 spectra, TVVQVAK | 0.000 | 0.000 | 0.169 | 0.670 | 0.000 | 0.000 | 0.154 | 0.007 | ||
| 3 spectra, TQFSDKPVQDR | 0.000 | 0.030 | 0.165 | 0.694 | 0.000 | 0.000 | 0.112 | 0.000 | ||
| 3 spectra, YIQTLK | 0.001 | 0.000 | 0.058 | 0.941 | 0.000 | 0.000 | 0.000 | 0.000 | ||
| 1 spectrum, VVWDSQAAEHFFEYK | 0.000 | 0.000 | 0.139 | 0.861 | 0.000 | 0.000 | 0.000 | 0.000 |
| Plot | Mito | Lyso or Perox | ER | Golgi | PM | Cytosol | Nucleus | ||||||
| Expt B |
3 peptides |
7 spectra |
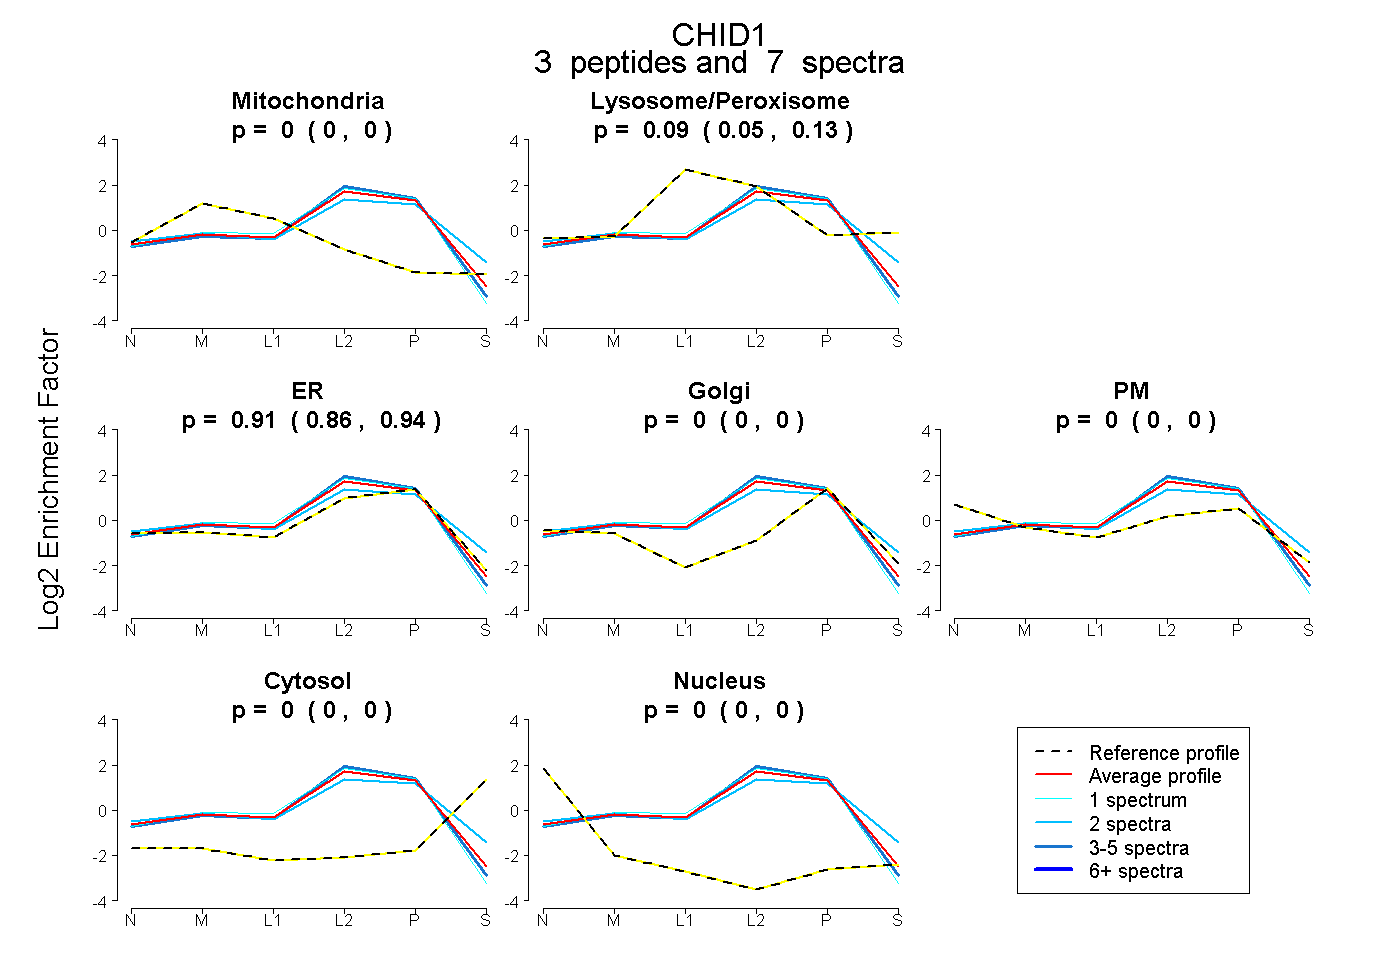 |
0.000 0.000 | 0.000 |
0.093 0.049 | 0.128 |
0.907 0.861 | 0.943 |
0.000 0.000 | 0.000 |
0.000 0.000 | 0.000 |
0.000 0.000 | 0.000 |
0.000 0.000 | 0.000 |
|||
| Plot | Lyso | Other | |||||||||||
| Expt C |
10 peptides |
52 spectra |
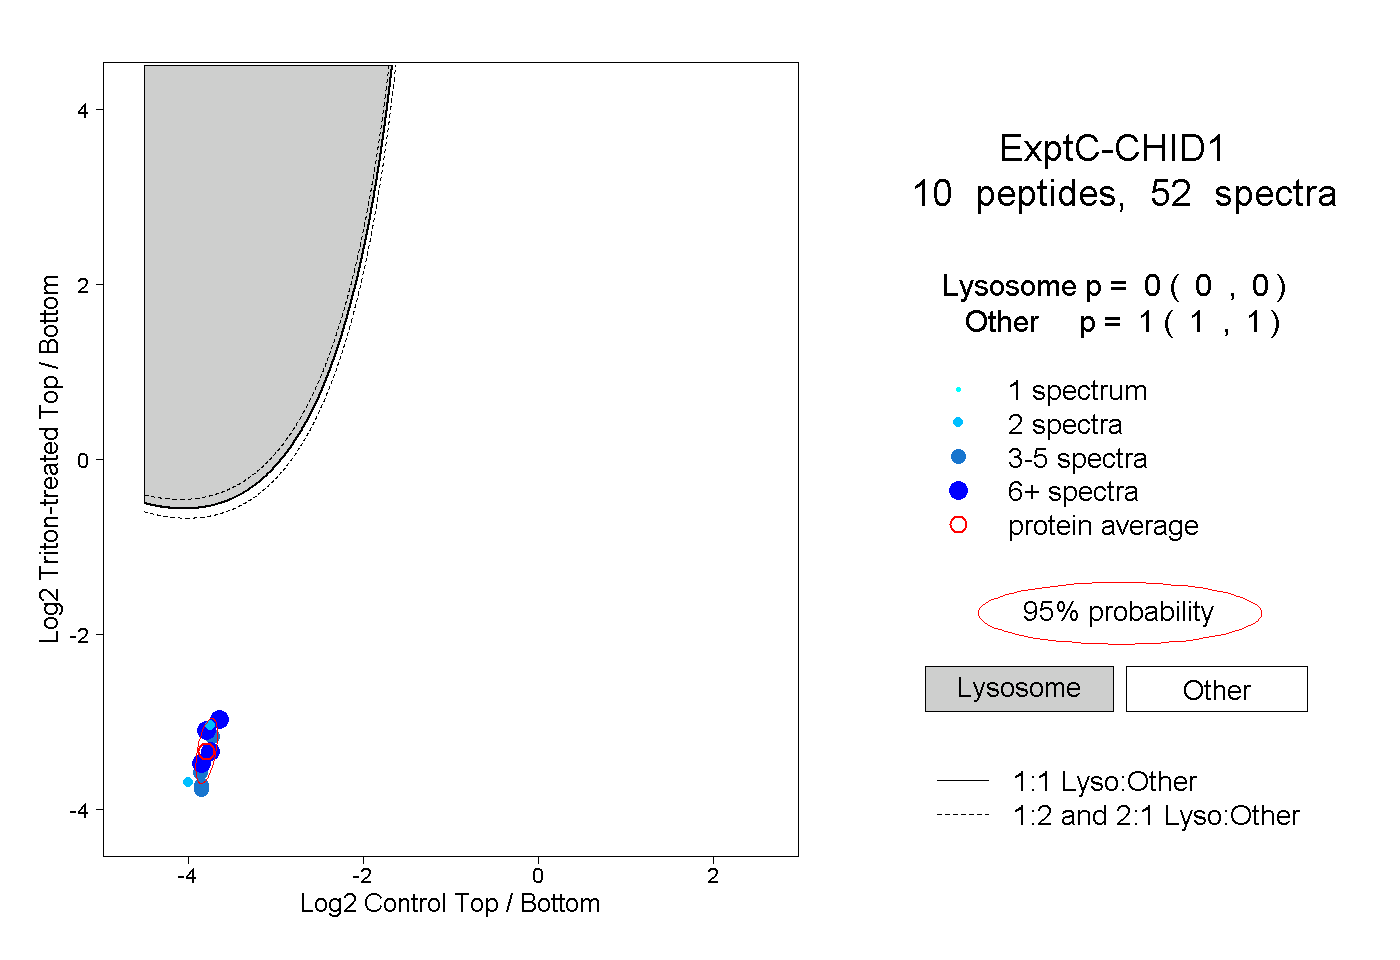 |
0.000 0.000 | 0.000 |
1.000 1.000 | 1.000 |
||||||||
| Plot | Lyso | Other | |||||||||||
| Expt D |
1 peptide |
2 spectra |
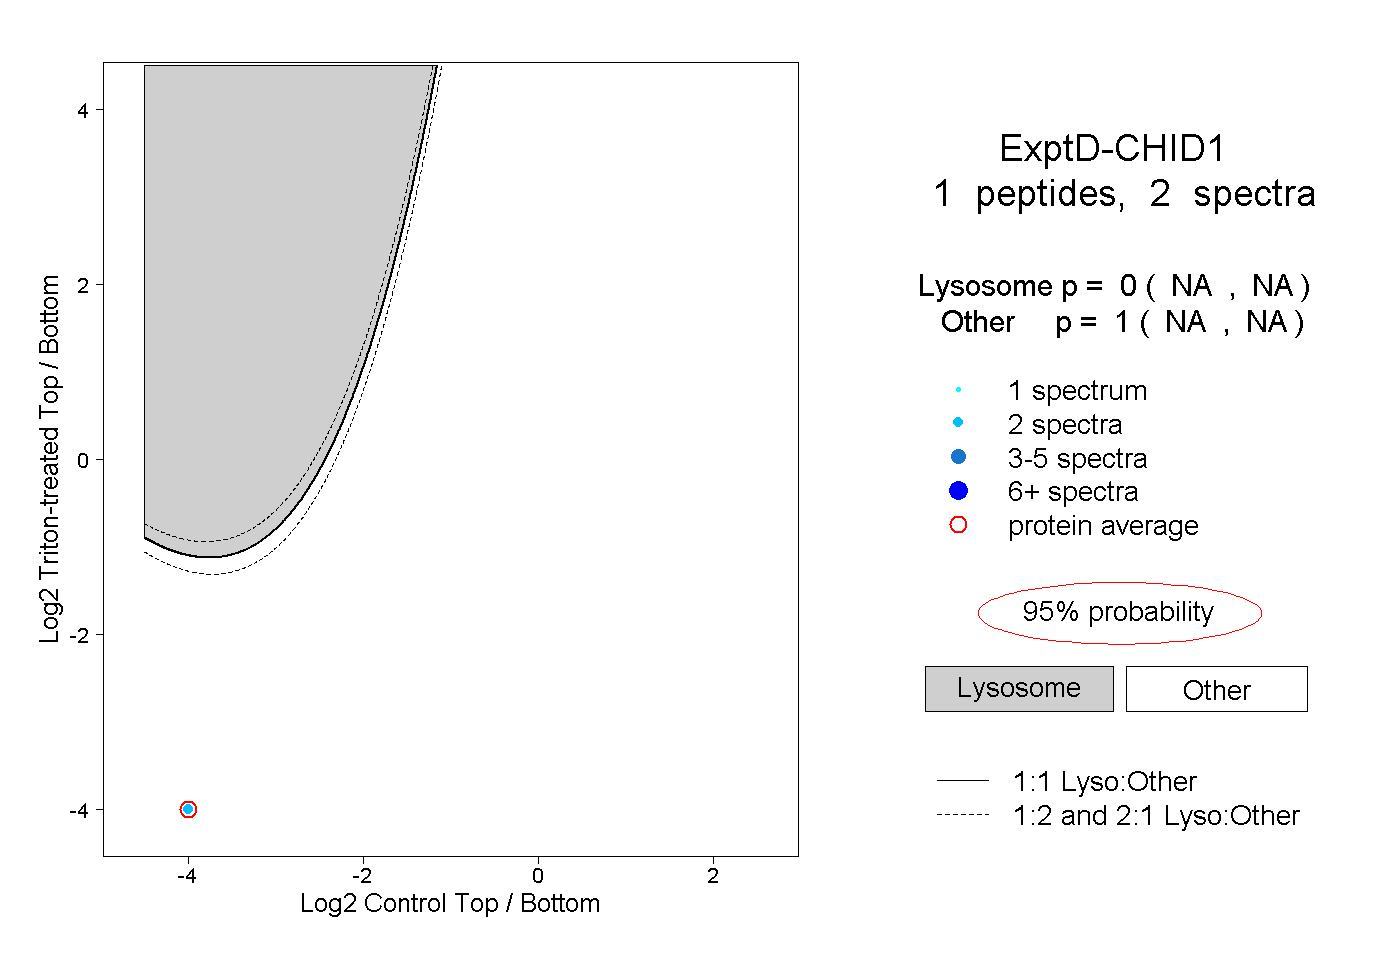 |
0.000 NA | NA |
1.000 NA | NA |