 7
7peptides
spectra
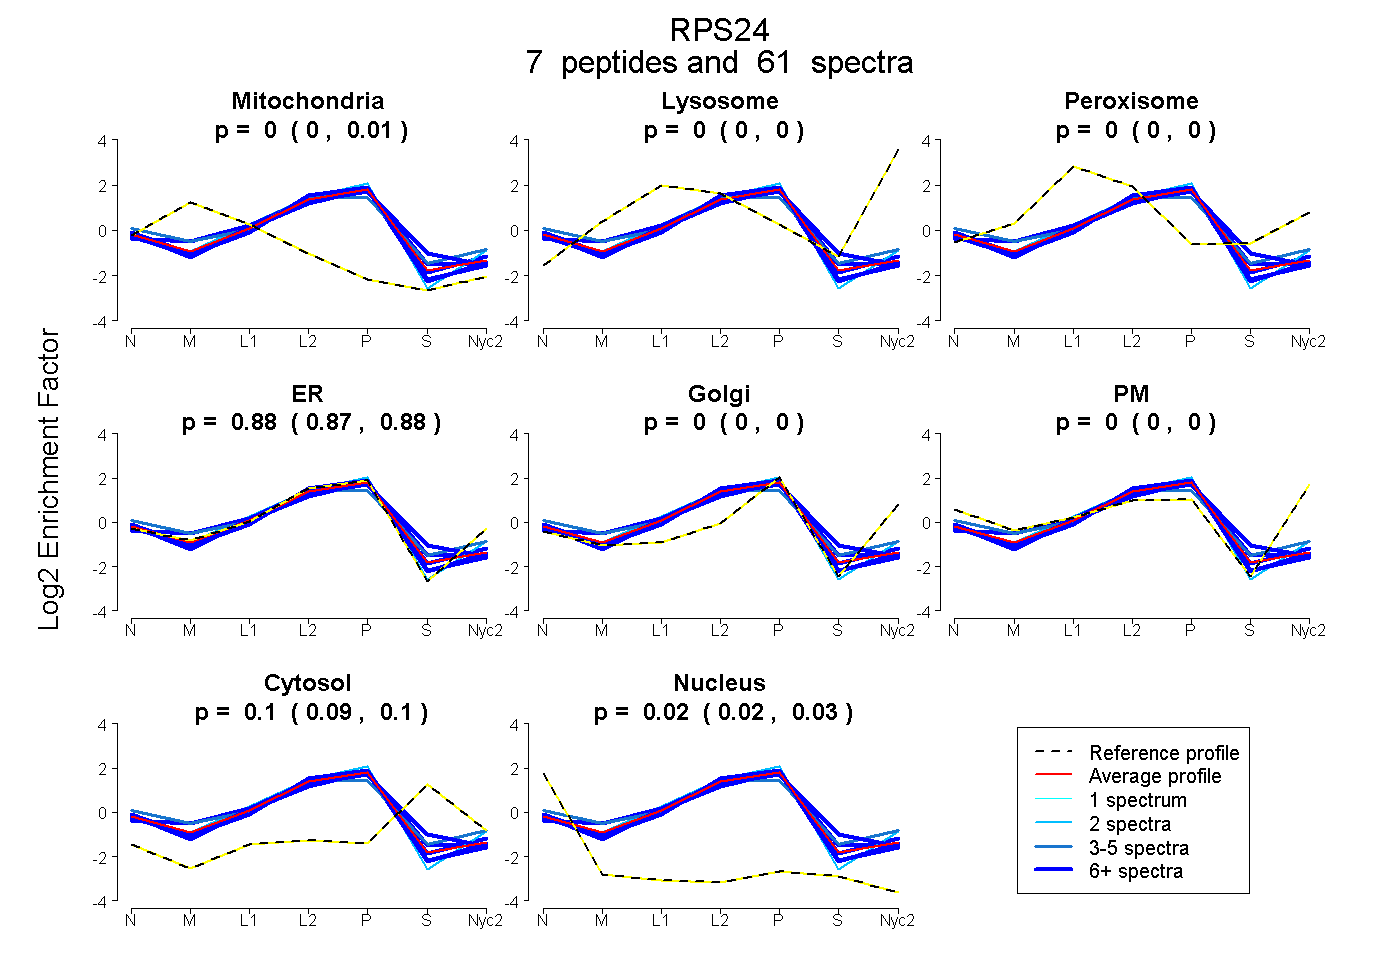
0.000 | 0.007
0.000 | 0.000
0.000 | 0.000
0.872 | 0.880
0.000 | 0.000
0.000 | 0.000
0.090 | 0.104
0.018 | 0.027
6peptides
spectra
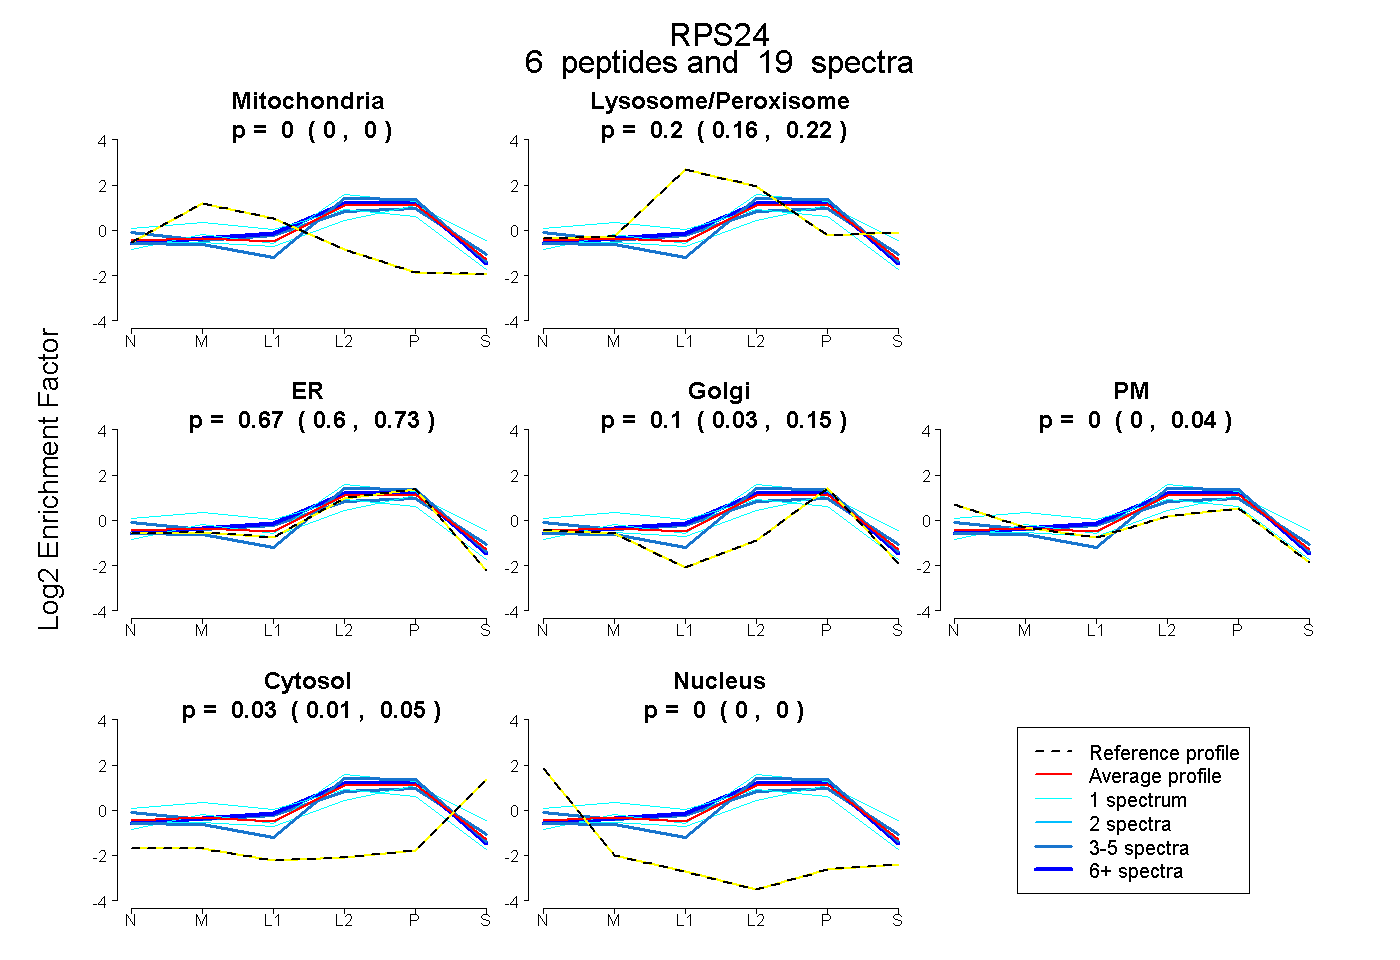
0.000 | 0.000
0.159 | 0.221
0.598 | 0.726
0.027 | 0.147
0.000 | 0.041
0.014 | 0.051
0.000 | 0.000
7peptides
spectra
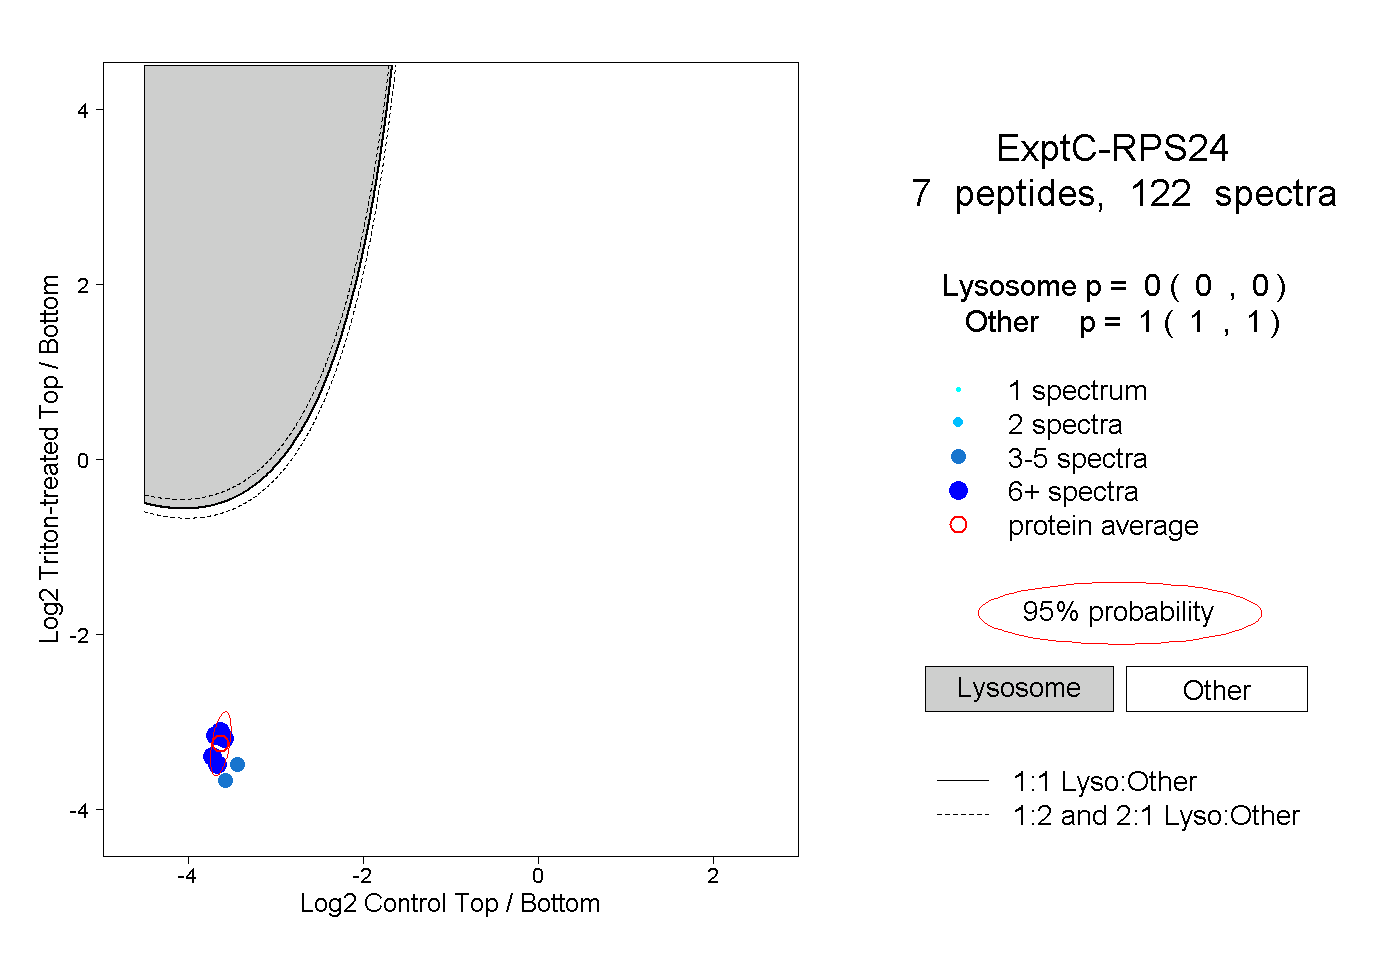
0.000 | 0.000
1.000 | 1.000
3peptides
spectra
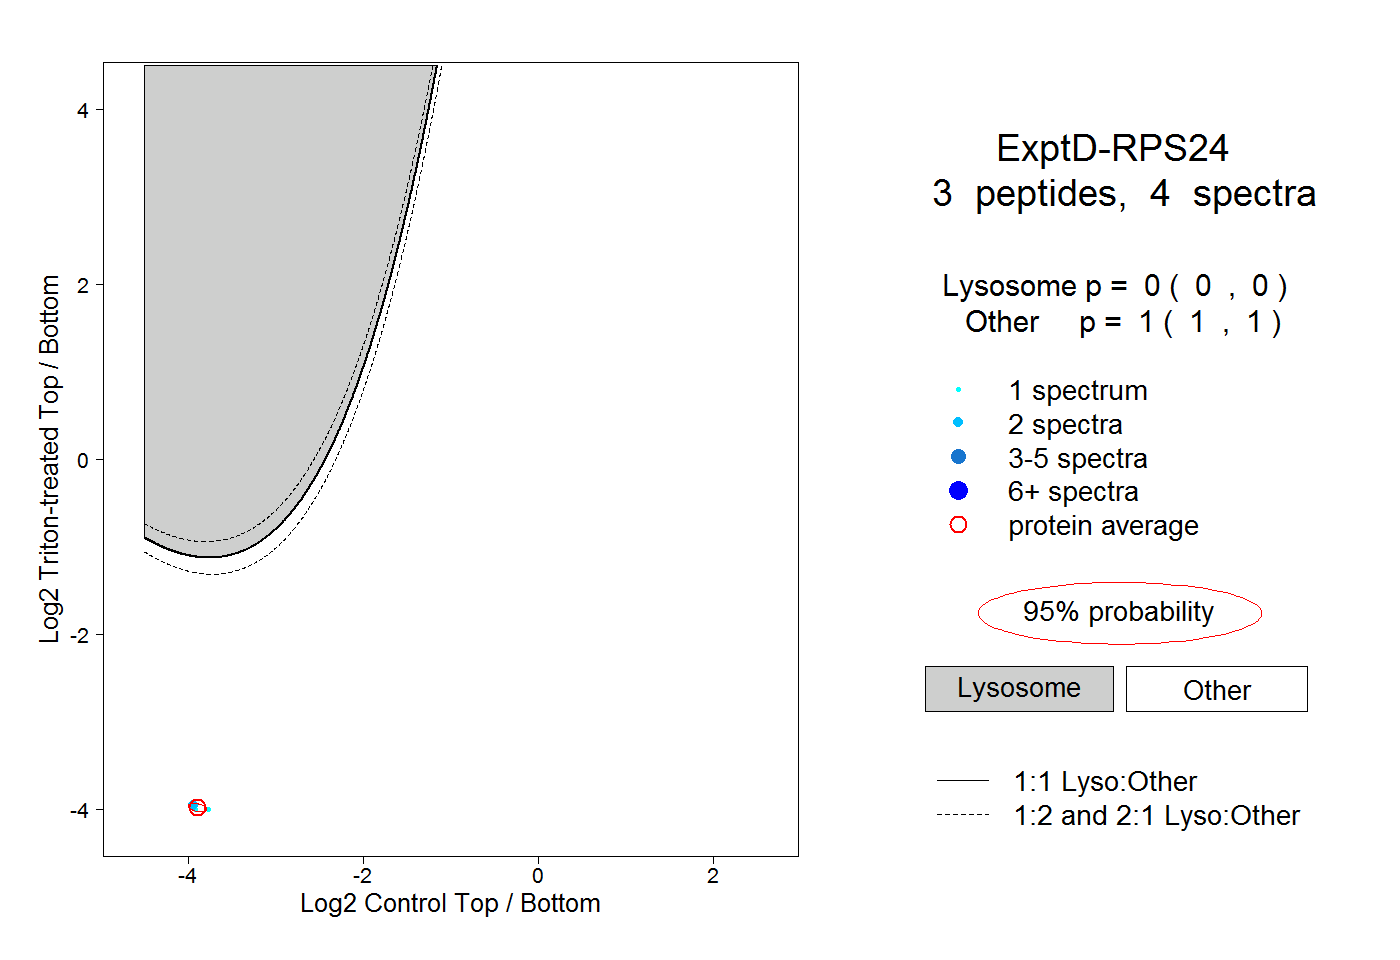
0.000 | 0.000
1.000 | 1.000