 16
16peptides
spectra
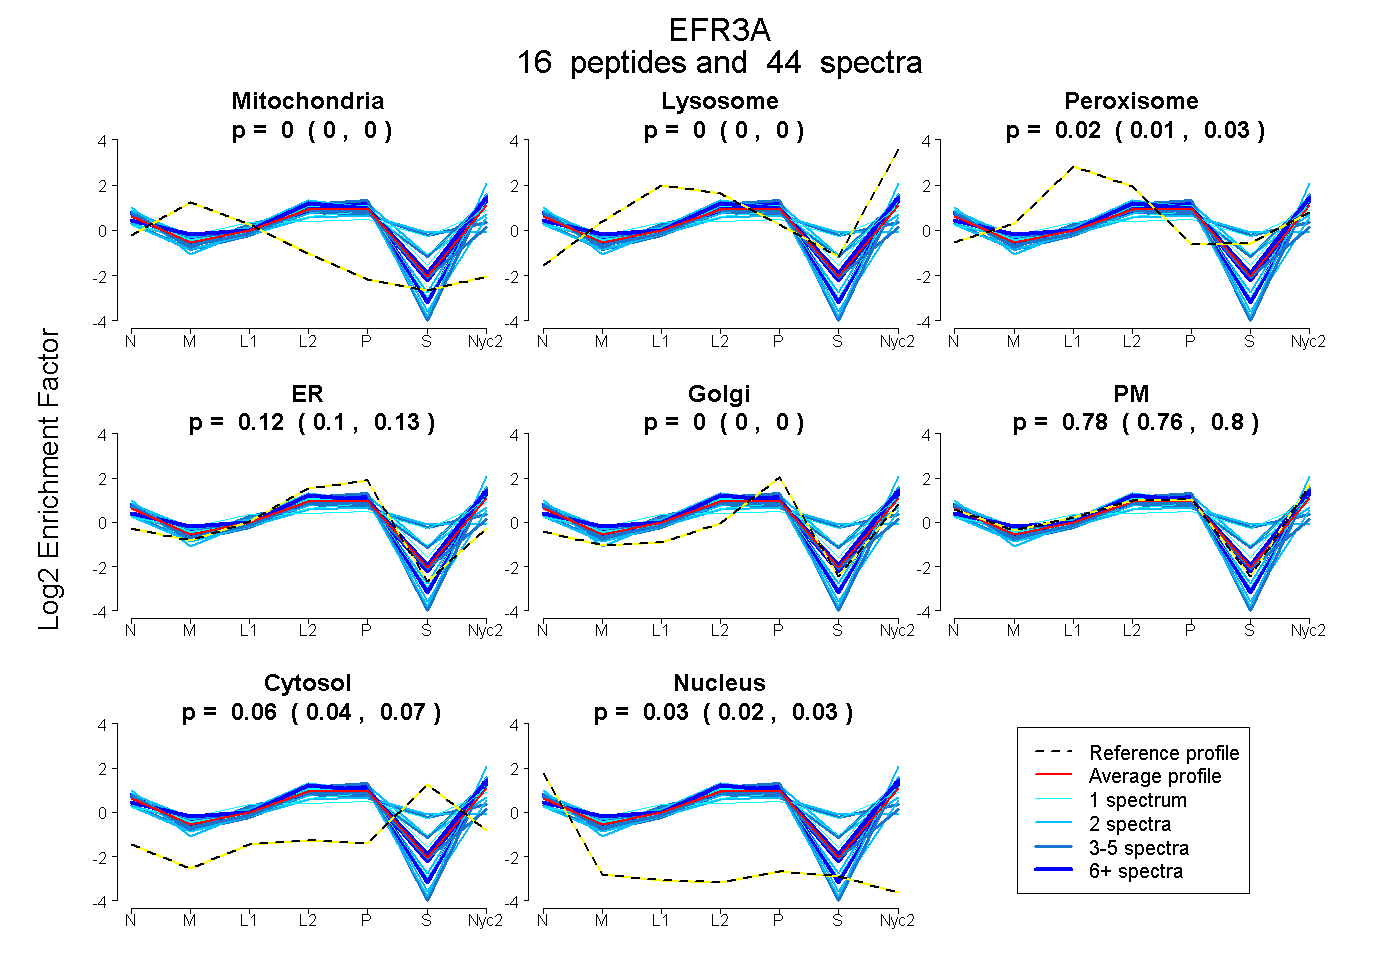
0.000 | 0.000
0.000 | 0.000
0.014 | 0.025
0.103 | 0.130
0.000 | 0.000
0.761 | 0.796
0.038 | 0.068
0.018 | 0.034
5peptides
spectra
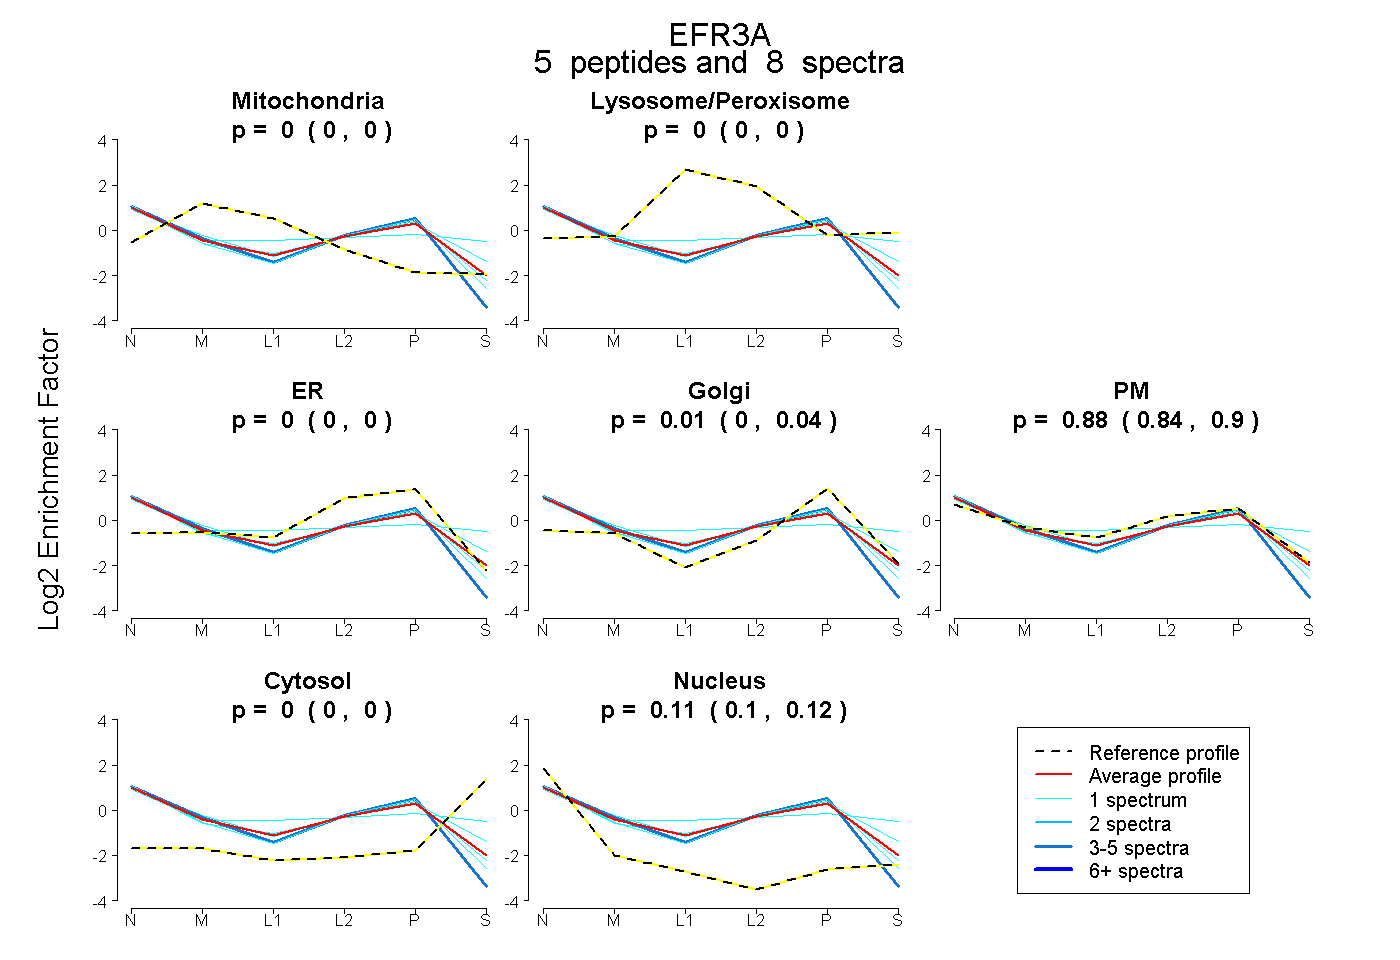
0.000 | 0.000
0.000 | 0.000
0.000 | 0.000
0.000 | 0.042
0.839 | 0.898
0.000 | 0.002
0.095 | 0.122
19peptides
spectra
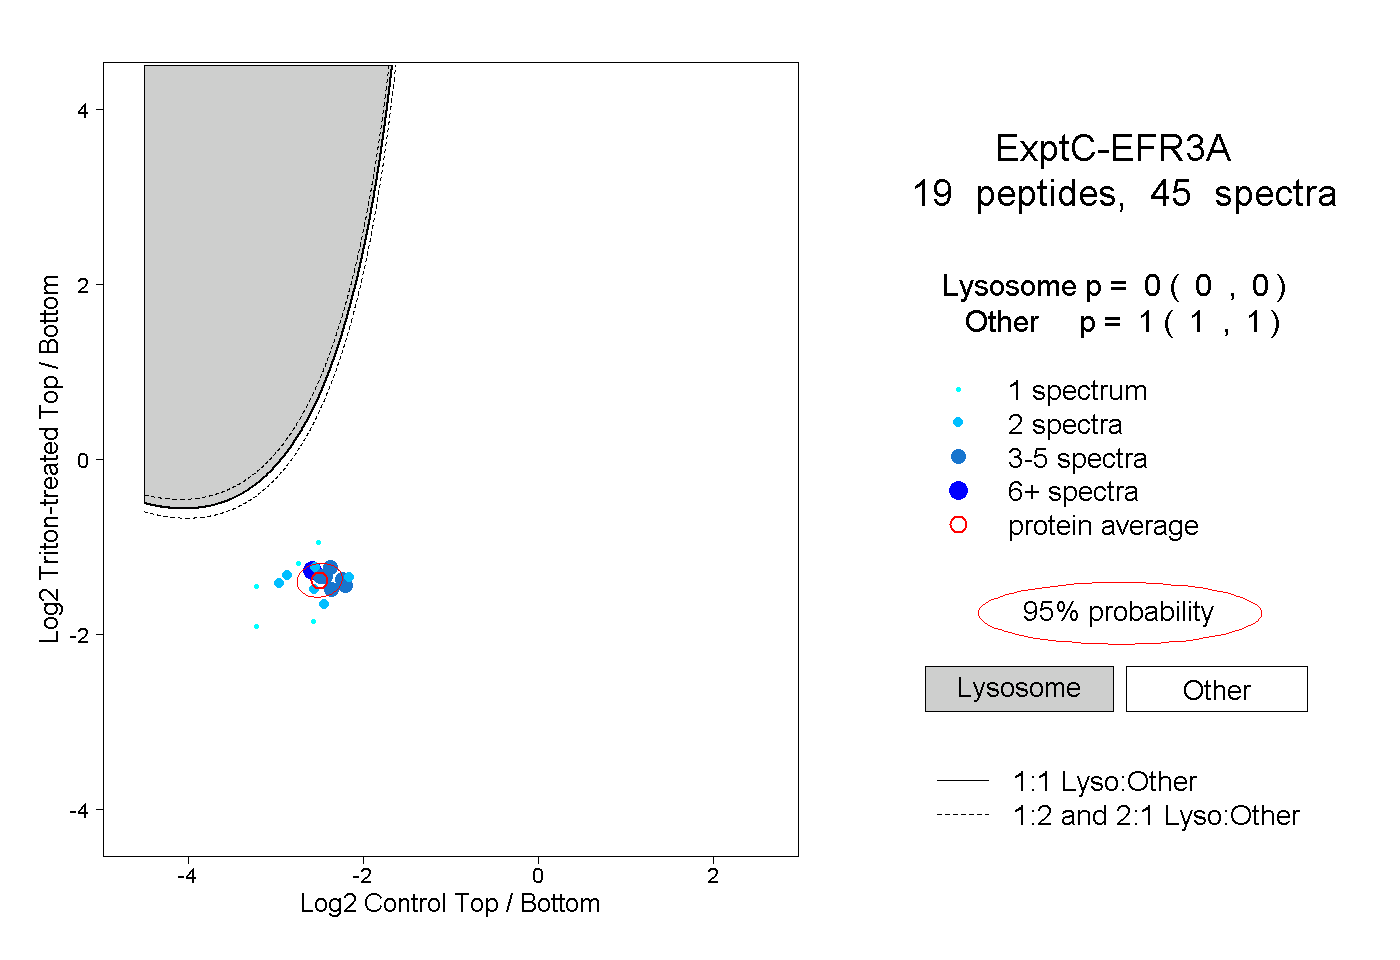
0.000 | 0.000
1.000 | 1.000
4peptides
spectra
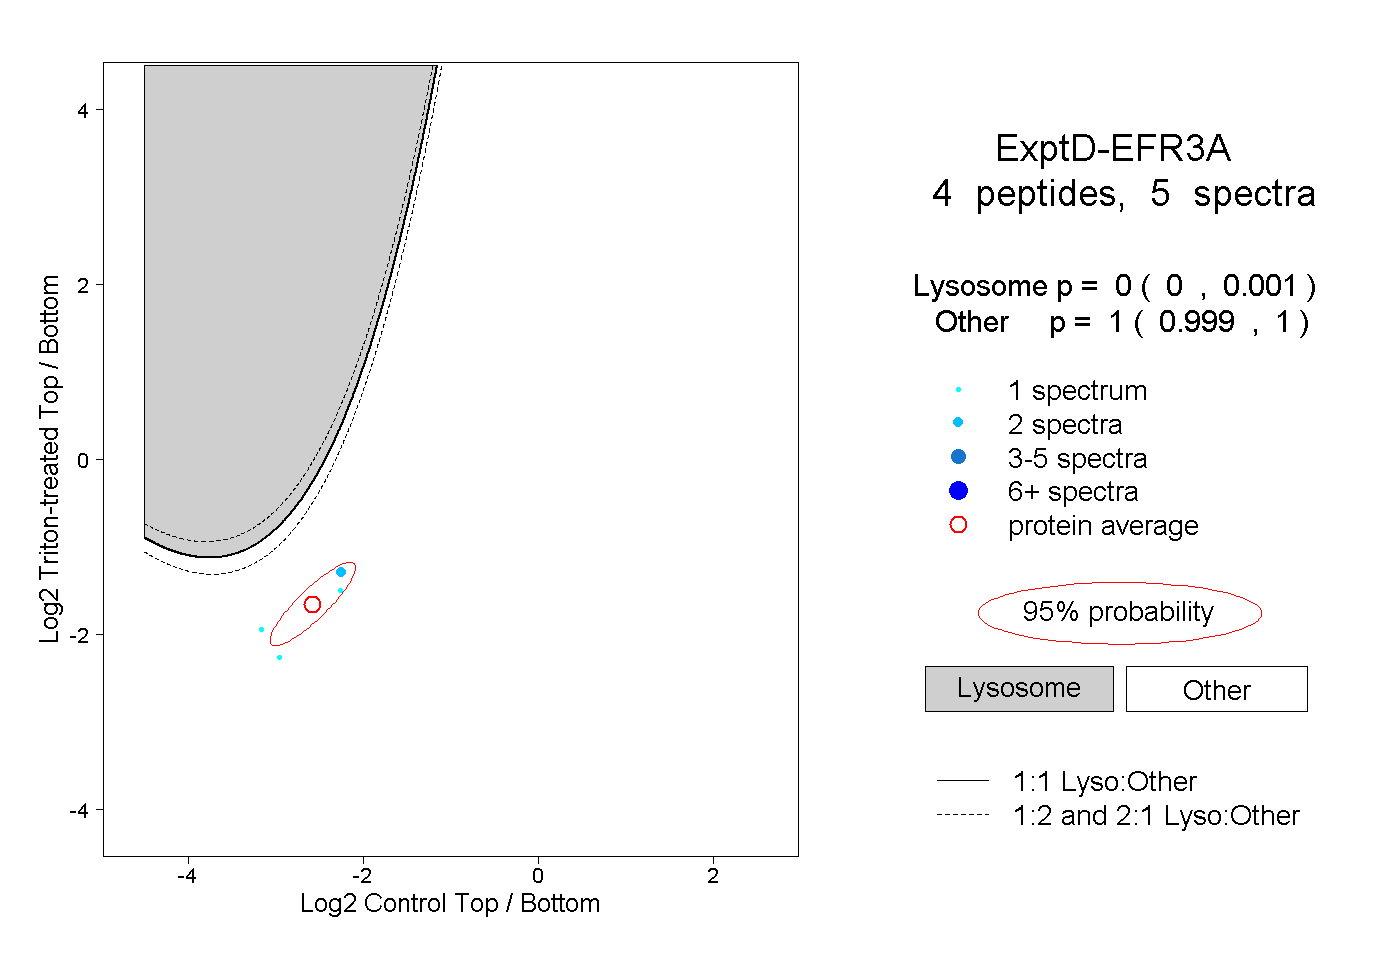
0.000 | 0.001
0.999 | 1.000