 16
16peptides
spectra
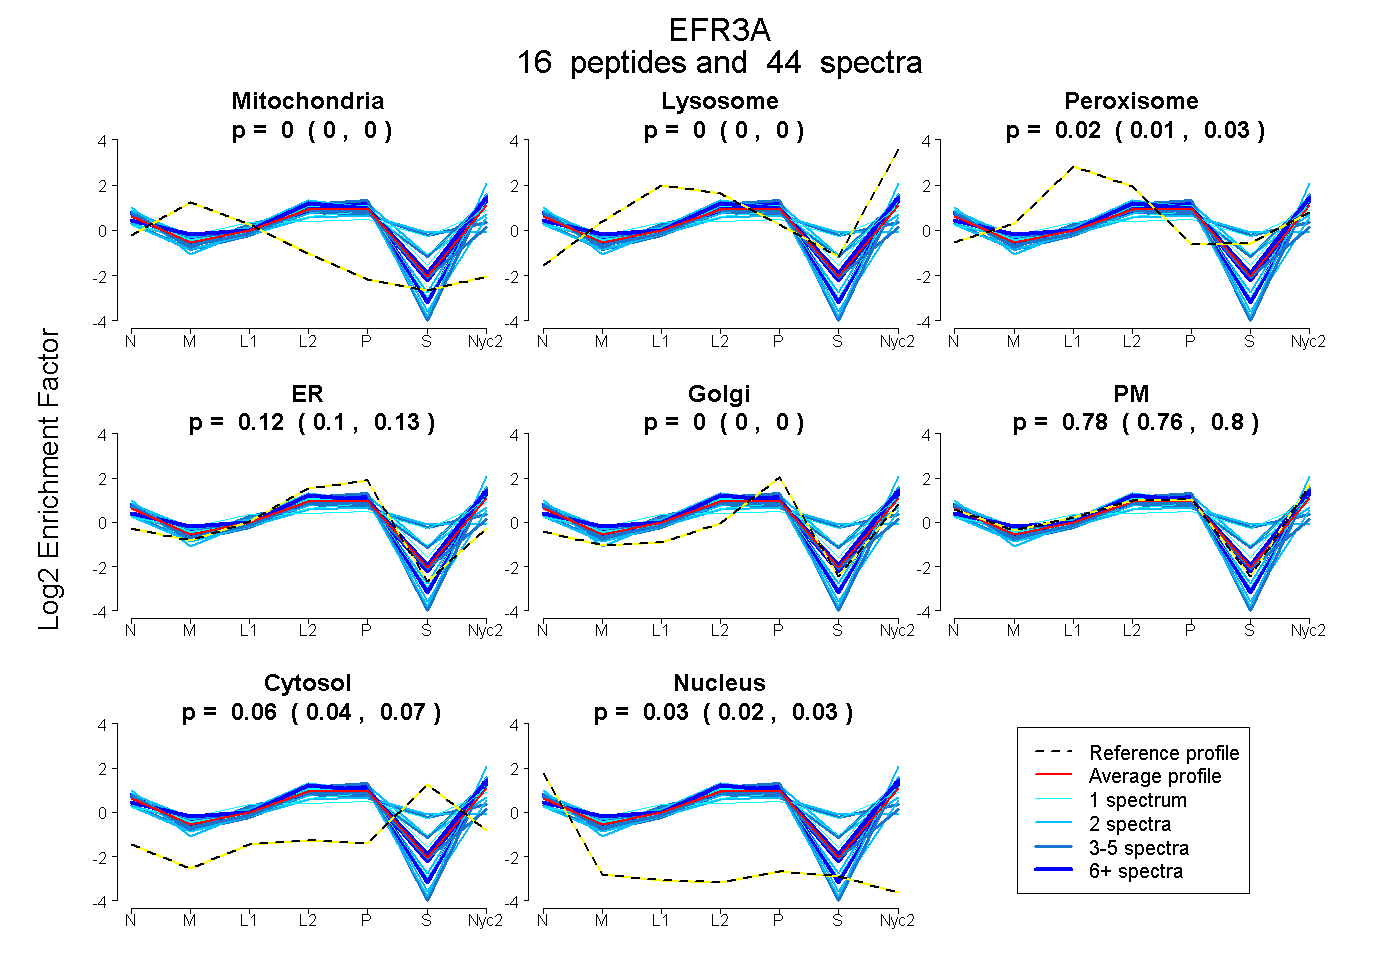
0.000 | 0.000
0.000 | 0.000
0.014 | 0.025
0.103 | 0.130
0.000 | 0.000
0.761 | 0.796
0.038 | 0.068
0.018 | 0.034
| Plot | Mito | Lyso | Perox | ER | Golgi | PM | Cytosol | Nucleus | |||||
| Expt A |
16 peptides |
44 spectra |
|
0.000 0.000 | 0.000 |
0.000 0.000 | 0.000 |
0.020 0.014 | 0.025 |
0.118 0.103 | 0.130 |
0.000 0.000 | 0.000 |
0.780 0.761 | 0.796 |
0.056 0.038 | 0.068 |
0.026 0.018 | 0.034 |
| 3 spectra, IVPSLLFNMQK | 0.000 | 0.000 | 0.000 | 0.129 | 0.000 | 0.871 | 0.000 | 0.000 | ||
| 2 spectra, IAESLGGSGYSVER | 0.006 | 0.000 | 0.000 | 0.000 | 0.000 | 0.966 | 0.000 | 0.029 | ||
| 2 spectra, NLYFLTNK | 0.000 | 0.000 | 0.000 | 0.000 | 0.000 | 1.000 | 0.000 | 0.000 | ||
| 1 spectrum, LTFYAVSAPEK | 0.000 | 0.000 | 0.250 | 0.000 | 0.000 | 0.487 | 0.263 | 0.000 | ||
| 3 spectra, LSVPYVPQVTDEDR | 0.000 | 0.000 | 0.102 | 0.000 | 0.000 | 0.753 | 0.145 | 0.000 | ||
| 3 spectra, VCCCCSALRPR | 0.000 | 0.000 | 0.095 | 0.342 | 0.000 | 0.436 | 0.000 | 0.126 | ||
| 2 spectra, APFEEIAAQCESK | 0.000 | 0.000 | 0.000 | 0.323 | 0.000 | 0.574 | 0.000 | 0.103 | ||
| 1 spectrum, TVNDELR | 0.000 | 0.000 | 0.057 | 0.000 | 0.000 | 0.752 | 0.191 | 0.000 | ||
| 3 spectra, ANLLHDR | 0.000 | 0.000 | 0.123 | 0.169 | 0.000 | 0.387 | 0.320 | 0.000 | ||
| 6 spectra, IEEVDSR | 0.000 | 0.000 | 0.009 | 0.031 | 0.000 | 0.902 | 0.017 | 0.041 | ||
| 6 spectra, QLVLEVMHNLMDR | 0.000 | 0.016 | 0.047 | 0.069 | 0.000 | 0.824 | 0.045 | 0.000 | ||
| 2 spectra, GLQGVVR | 0.000 | 0.000 | 0.108 | 0.256 | 0.000 | 0.490 | 0.146 | 0.000 | ||
| 2 spectra, HIYLGCK | 0.000 | 0.000 | 0.143 | 0.253 | 0.000 | 0.244 | 0.359 | 0.000 | ||
| 1 spectrum, LVDNIFPEDPK | 0.000 | 0.026 | 0.000 | 0.000 | 0.000 | 0.881 | 0.094 | 0.000 | ||
| 6 spectra, IQIMLLR | 0.000 | 0.000 | 0.000 | 0.075 | 0.000 | 0.910 | 0.000 | 0.015 | ||
| 1 spectrum, LQVLGTNSFVK | 0.000 | 0.000 | 0.000 | 0.090 | 0.000 | 0.869 | 0.000 | 0.041 |
| Plot | Mito | Lyso or Perox | ER | Golgi | PM | Cytosol | Nucleus | ||||||
| Expt B |
5 peptides |
8 spectra |
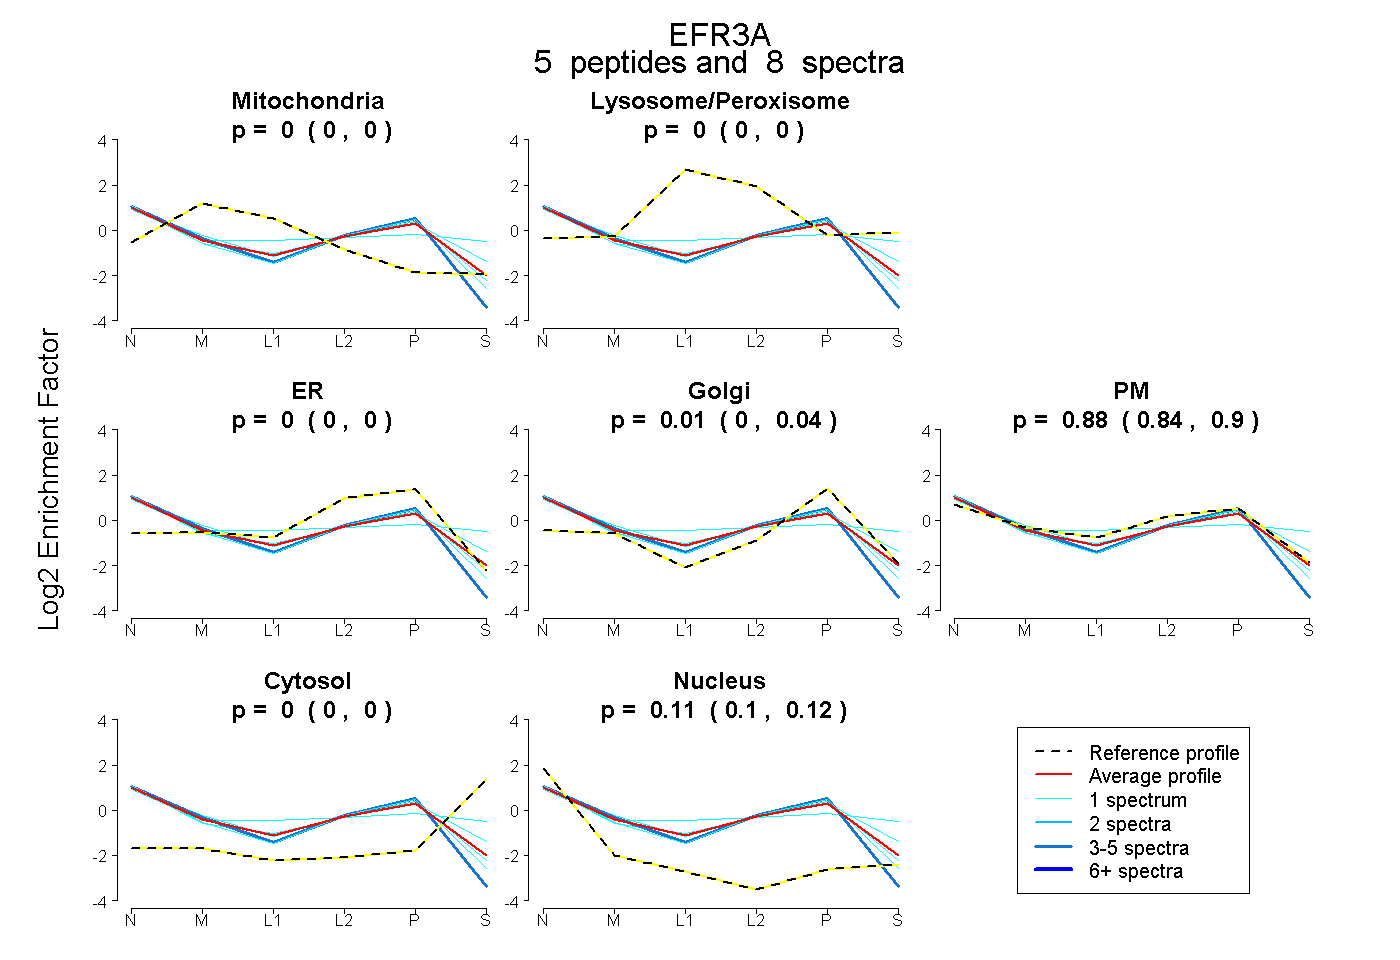 |
0.000 0.000 | 0.000 |
0.000 0.000 | 0.000 |
0.000 0.000 | 0.000 |
0.012 0.000 | 0.042 |
0.878 0.839 | 0.898 |
0.000 0.000 | 0.002 |
0.110 0.095 | 0.122 |
|||
| Plot | Lyso | Other | |||||||||||
| Expt C |
19 peptides |
45 spectra |
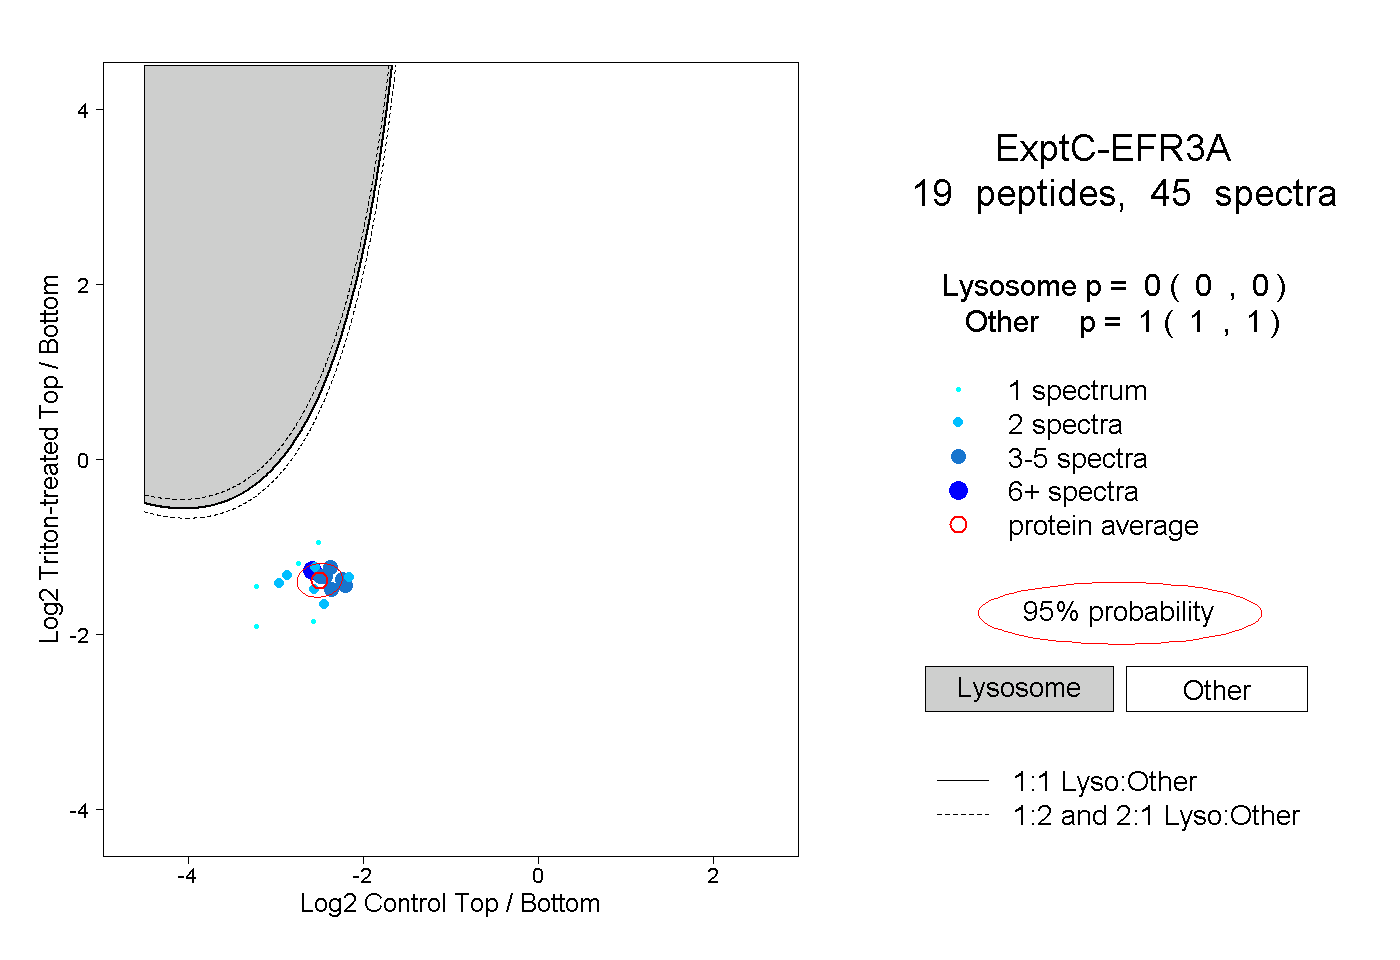 |
0.000 0.000 | 0.000 |
1.000 1.000 | 1.000 |
||||||||
| Plot | Lyso | Other | |||||||||||
| Expt D |
4 peptides |
5 spectra |
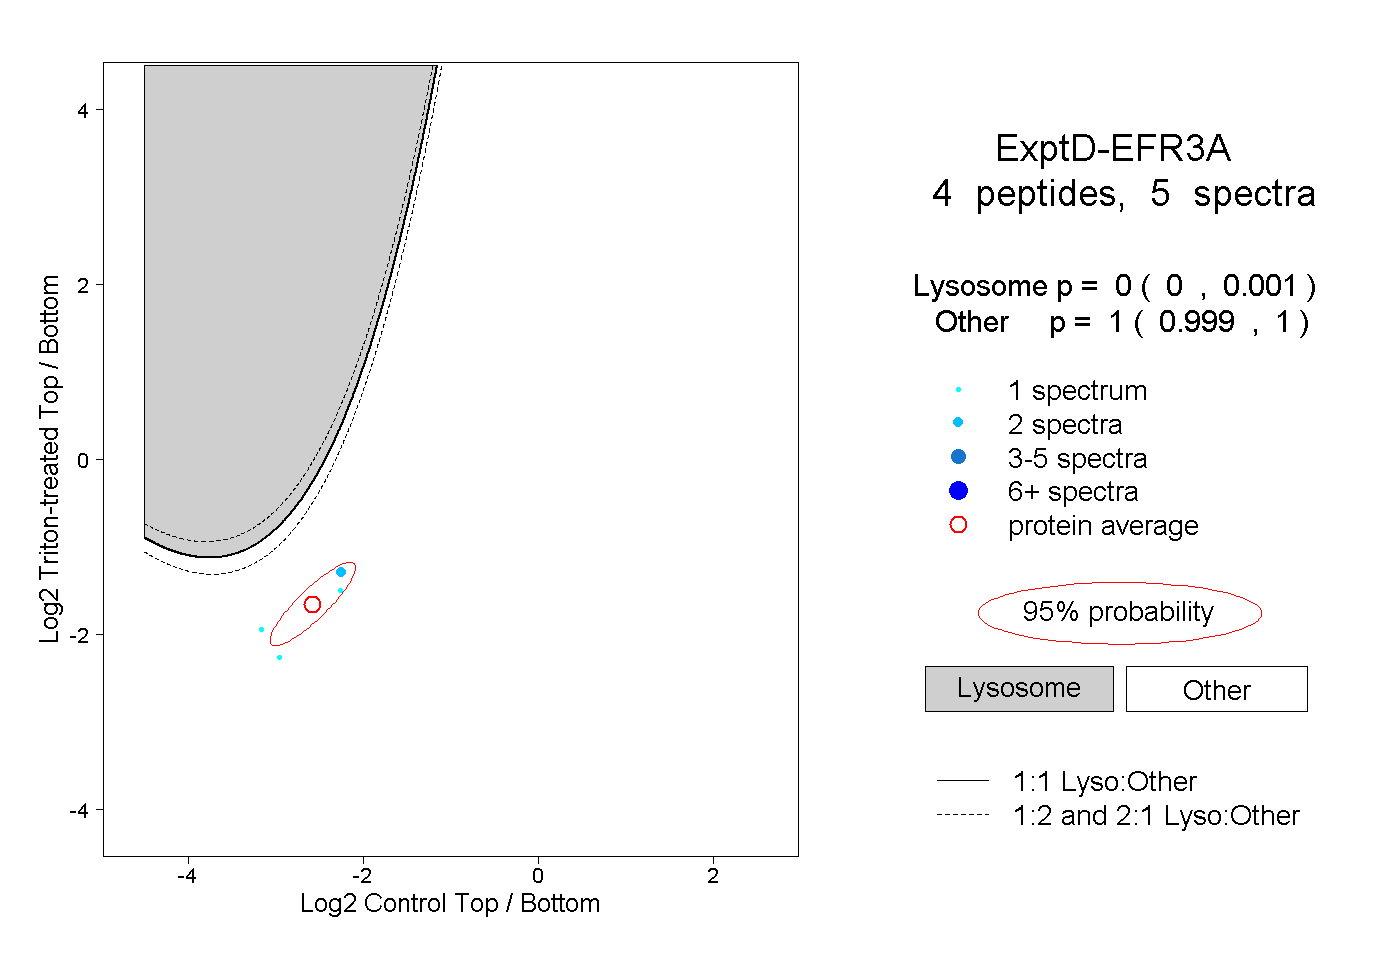 |
0.000 0.000 | 0.001 |
1.000 0.999 | 1.000 |