 15
15peptides
spectra
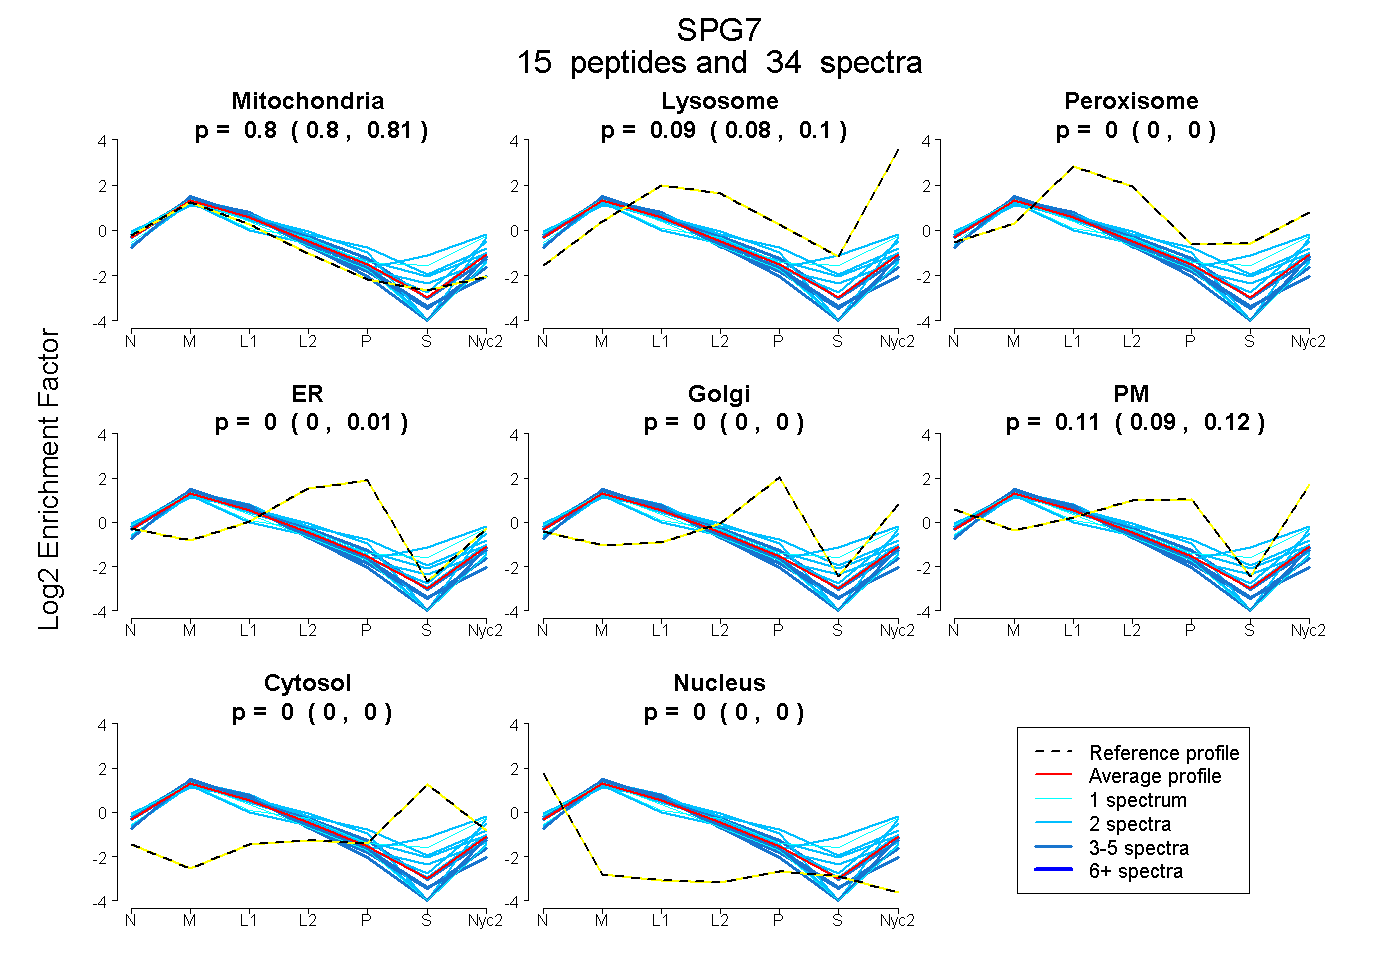
0.796 | 0.807
0.080 | 0.097
0.000 | 0.000
0.000 | 0.015
0.000 | 0.000
0.088 | 0.116
0.000 | 0.000
0.000 | 0.000
5peptides
spectra
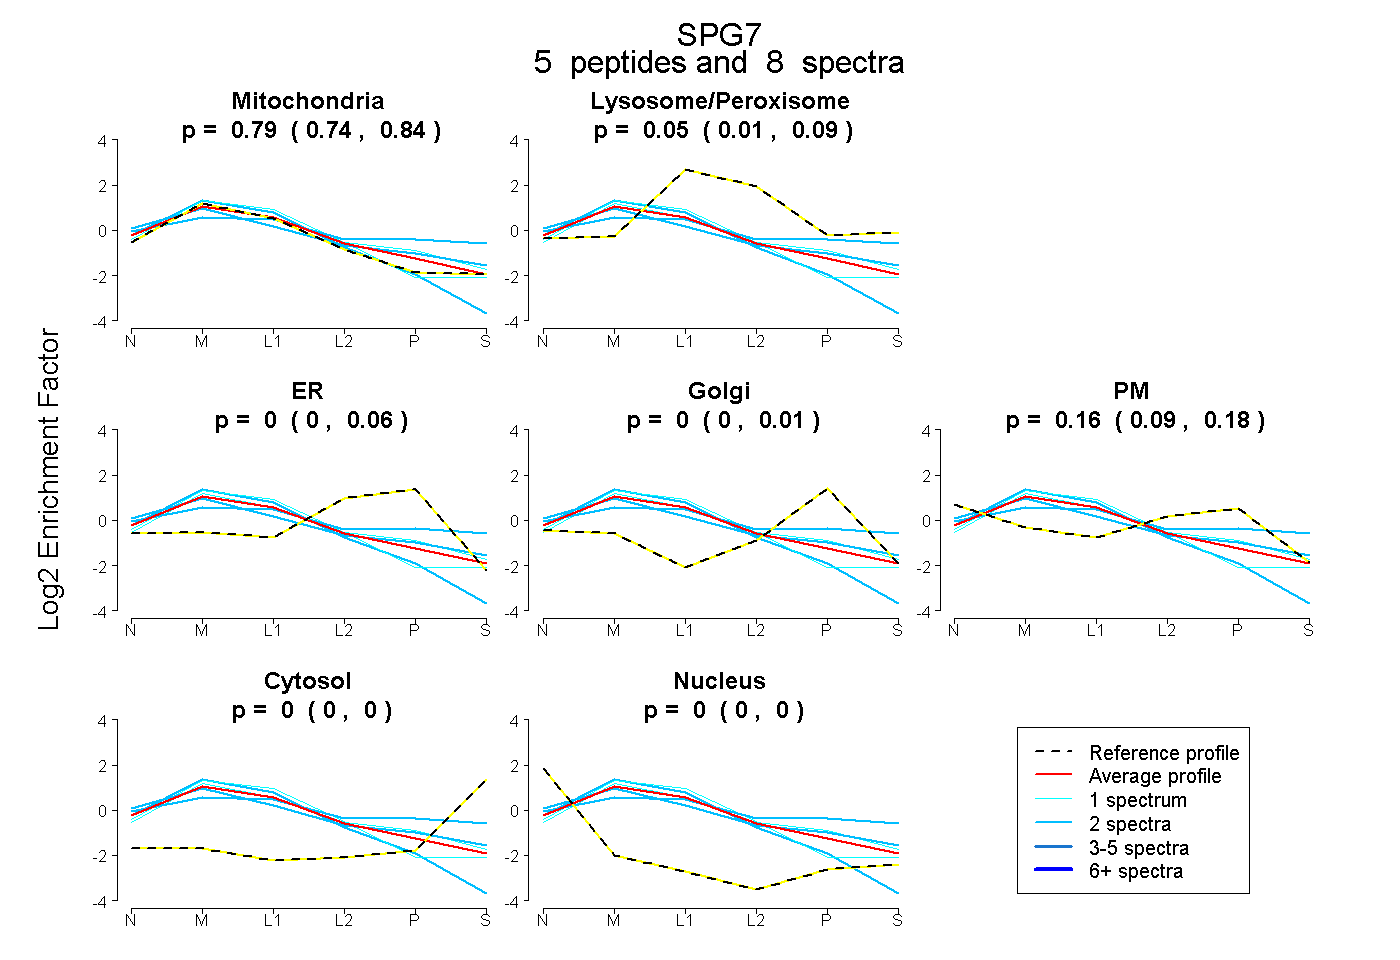
0.740 | 0.837
0.006 | 0.086
0.000 | 0.058
0.000 | 0.012
0.094 | 0.184
0.000 | 0.000
0.000 | 0.000
22peptides
spectra
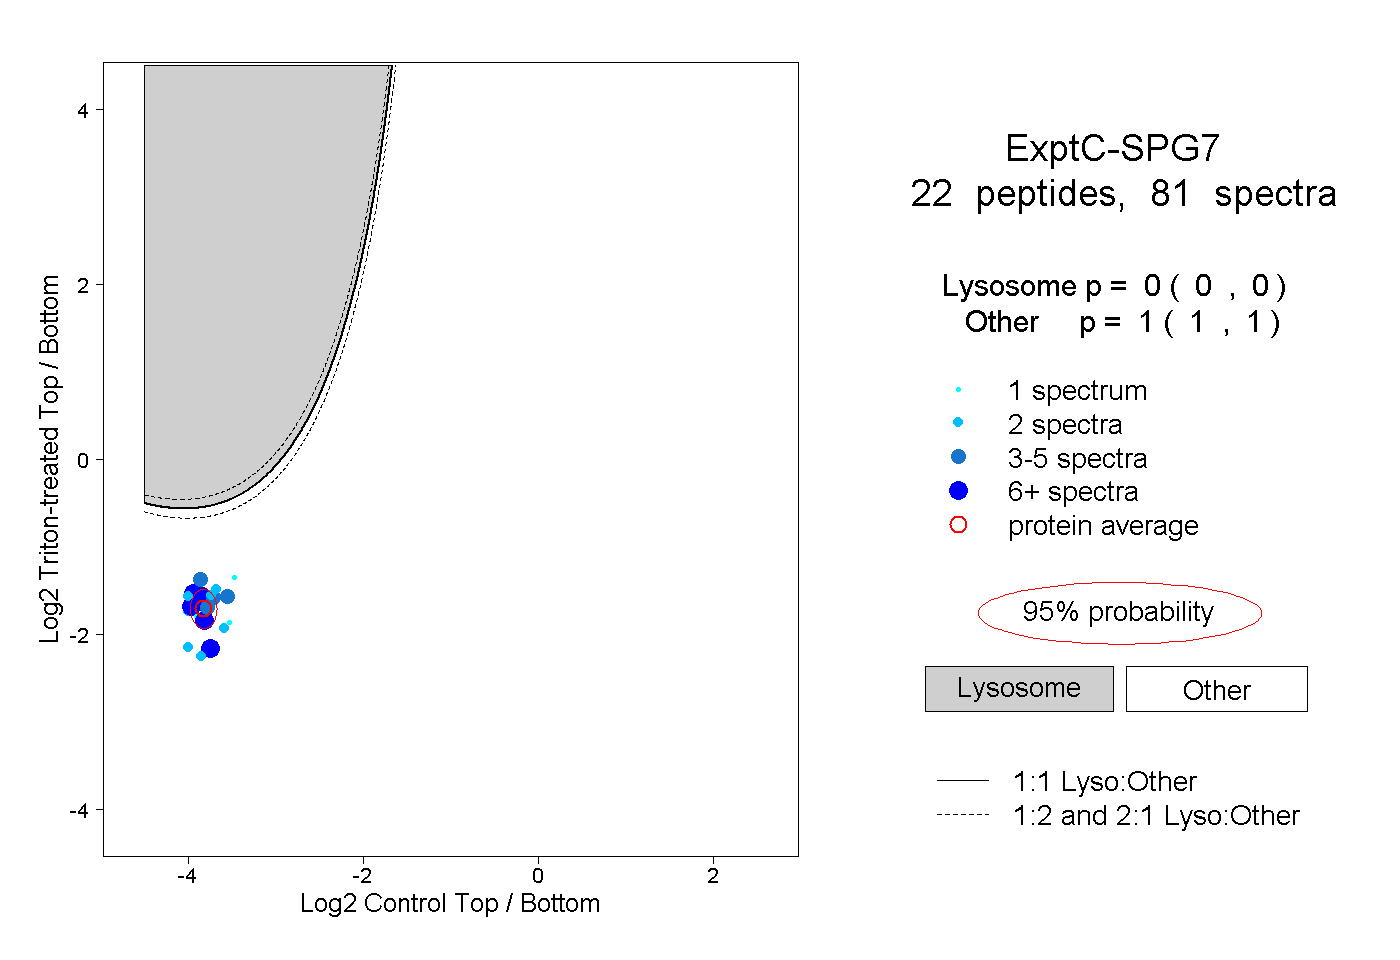
0.000 | 0.000
1.000 | 1.000
5peptides
spectra
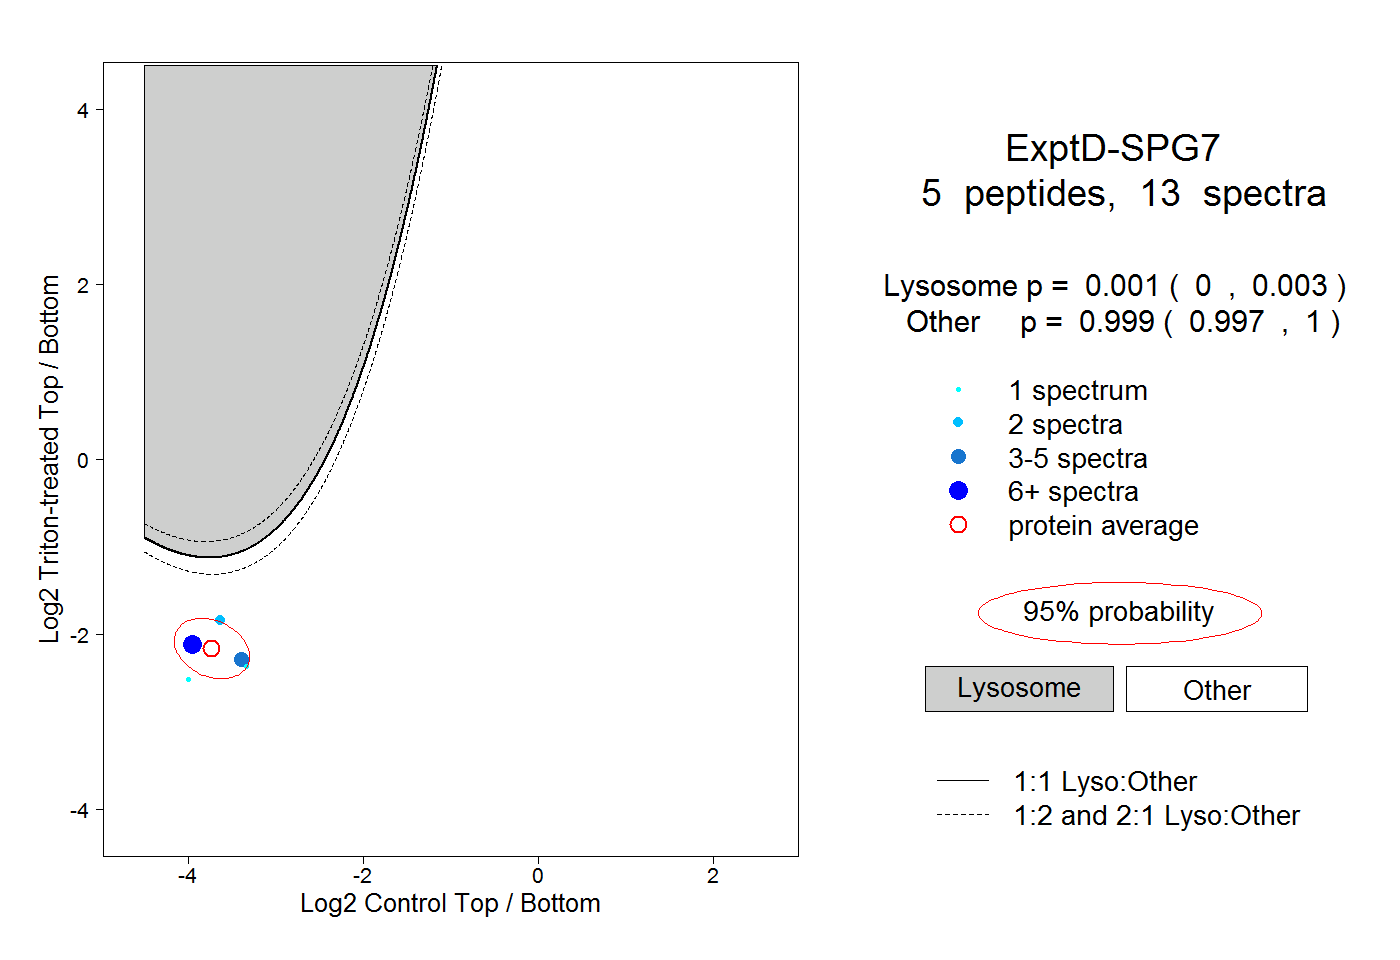
0.000 | 0.003
0.997 | 1.000