 15
15peptides
spectra
0.796 | 0.807
0.080 | 0.097
0.000 | 0.000
0.000 | 0.015
0.000 | 0.000
0.088 | 0.116
0.000 | 0.000
0.000 | 0.000
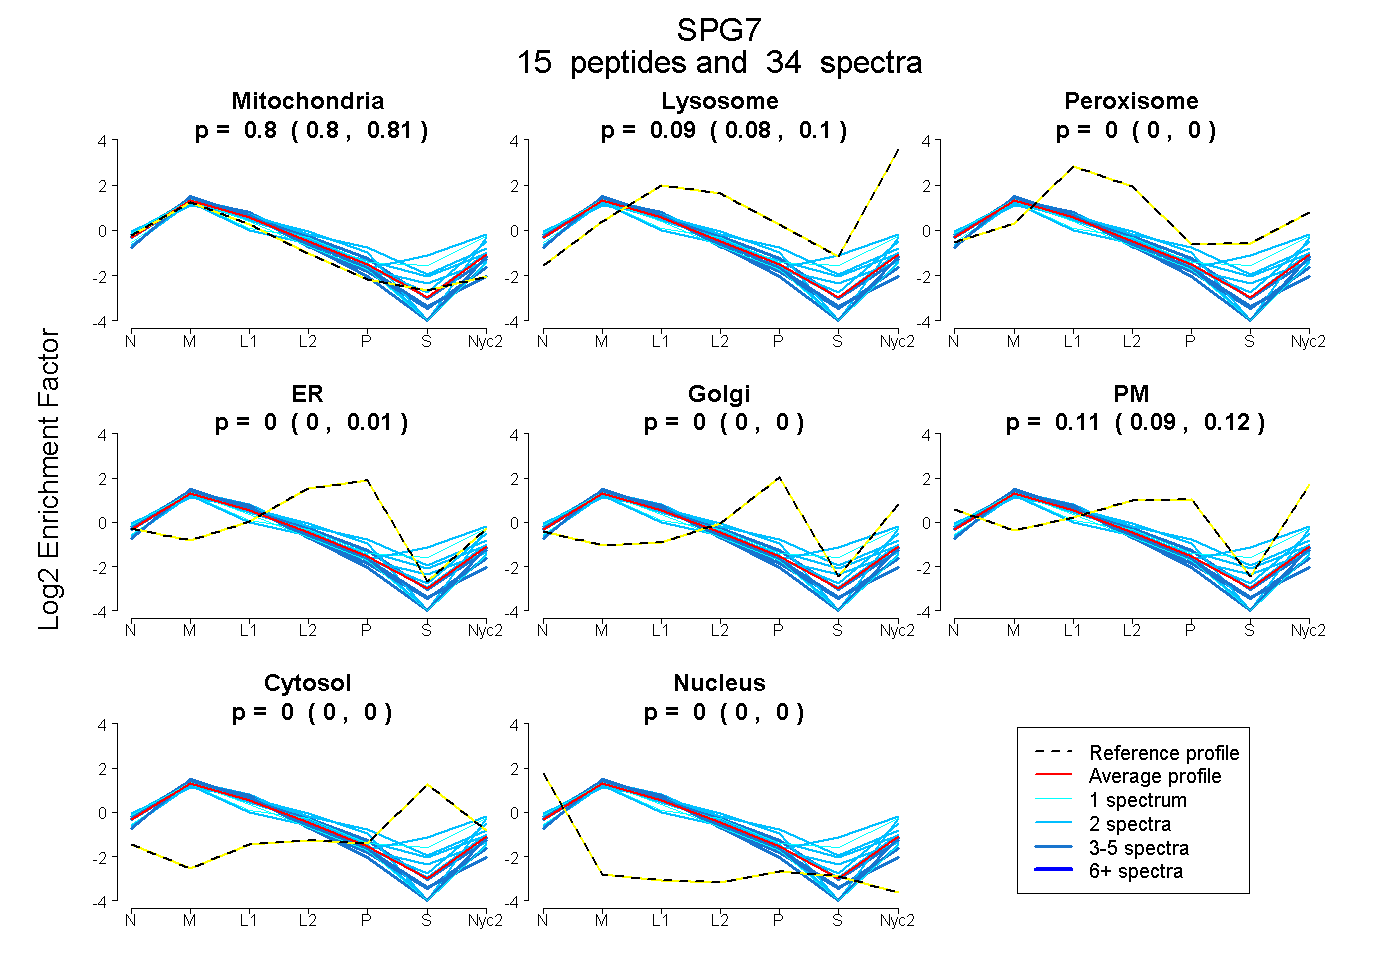
| Plot | Mito | Lyso | Perox | ER | Golgi | PM | Cytosol | Nucleus | |||||
| Expt A |
15 peptides |
34 spectra |
|
0.802 0.796 | 0.807 |
0.089 0.080 | 0.097 |
0.000 0.000 | 0.000 |
0.003 0.000 | 0.015 |
0.000 0.000 | 0.000 |
0.107 0.088 | 0.116 |
0.000 0.000 | 0.000 |
0.000 0.000 | 0.000 |
| 2 spectra, EQLFER | 0.802 | 0.000 | 0.116 | 0.000 | 0.000 | 0.083 | 0.000 | 0.000 | ||
| 3 spectra, EFVDYLK | 0.906 | 0.011 | 0.000 | 0.013 | 0.000 | 0.069 | 0.000 | 0.000 | ||
| 2 spectra, AAEDELNIESK | 0.801 | 0.027 | 0.000 | 0.030 | 0.000 | 0.142 | 0.000 | 0.000 | ||
| 1 spectrum, VSIAPR | 0.877 | 0.000 | 0.000 | 0.004 | 0.000 | 0.118 | 0.000 | 0.000 | ||
| 2 spectra, ADVLDNALMRPGR | 0.748 | 0.093 | 0.102 | 0.000 | 0.057 | 0.000 | 0.000 | 0.000 | ||
| 2 spectra, LAGMTGR | 0.597 | 0.245 | 0.000 | 0.000 | 0.000 | 0.000 | 0.158 | 0.000 | ||
| 3 spectra, EGGFSAFNQLK | 0.767 | 0.080 | 0.000 | 0.140 | 0.000 | 0.013 | 0.000 | 0.000 | ||
| 2 spectra, EVINYEDIEALIGPPPHGPK | 0.583 | 0.024 | 0.219 | 0.007 | 0.145 | 0.022 | 0.000 | 0.000 | ||
| 2 spectra, GALLLGPPGCGK | 0.625 | 0.041 | 0.000 | 0.000 | 0.000 | 0.335 | 0.000 | 0.000 | ||
| 1 spectrum, HVFIDLPTLQER | 0.640 | 0.269 | 0.000 | 0.000 | 0.000 | 0.002 | 0.088 | 0.000 | ||
| 2 spectra, EIFEQHLK | 0.757 | 0.174 | 0.000 | 0.000 | 0.000 | 0.069 | 0.000 | 0.000 | ||
| 3 spectra, LTQPSSFYSQR | 0.879 | 0.038 | 0.000 | 0.000 | 0.000 | 0.083 | 0.000 | 0.000 | ||
| 2 spectra, FLQLGAK | 0.786 | 0.082 | 0.000 | 0.000 | 0.000 | 0.132 | 0.000 | 0.000 | ||
| 5 spectra, MCMALGGR | 0.909 | 0.000 | 0.000 | 0.091 | 0.000 | 0.000 | 0.000 | 0.000 | ||
| 2 spectra, AAEAISFSR | 0.854 | 0.000 | 0.000 | 0.016 | 0.000 | 0.130 | 0.000 | 0.000 |
| Plot | Mito | Lyso or Perox | ER | Golgi | PM | Cytosol | Nucleus | ||||||
| Expt B |
5 peptides |
8 spectra |
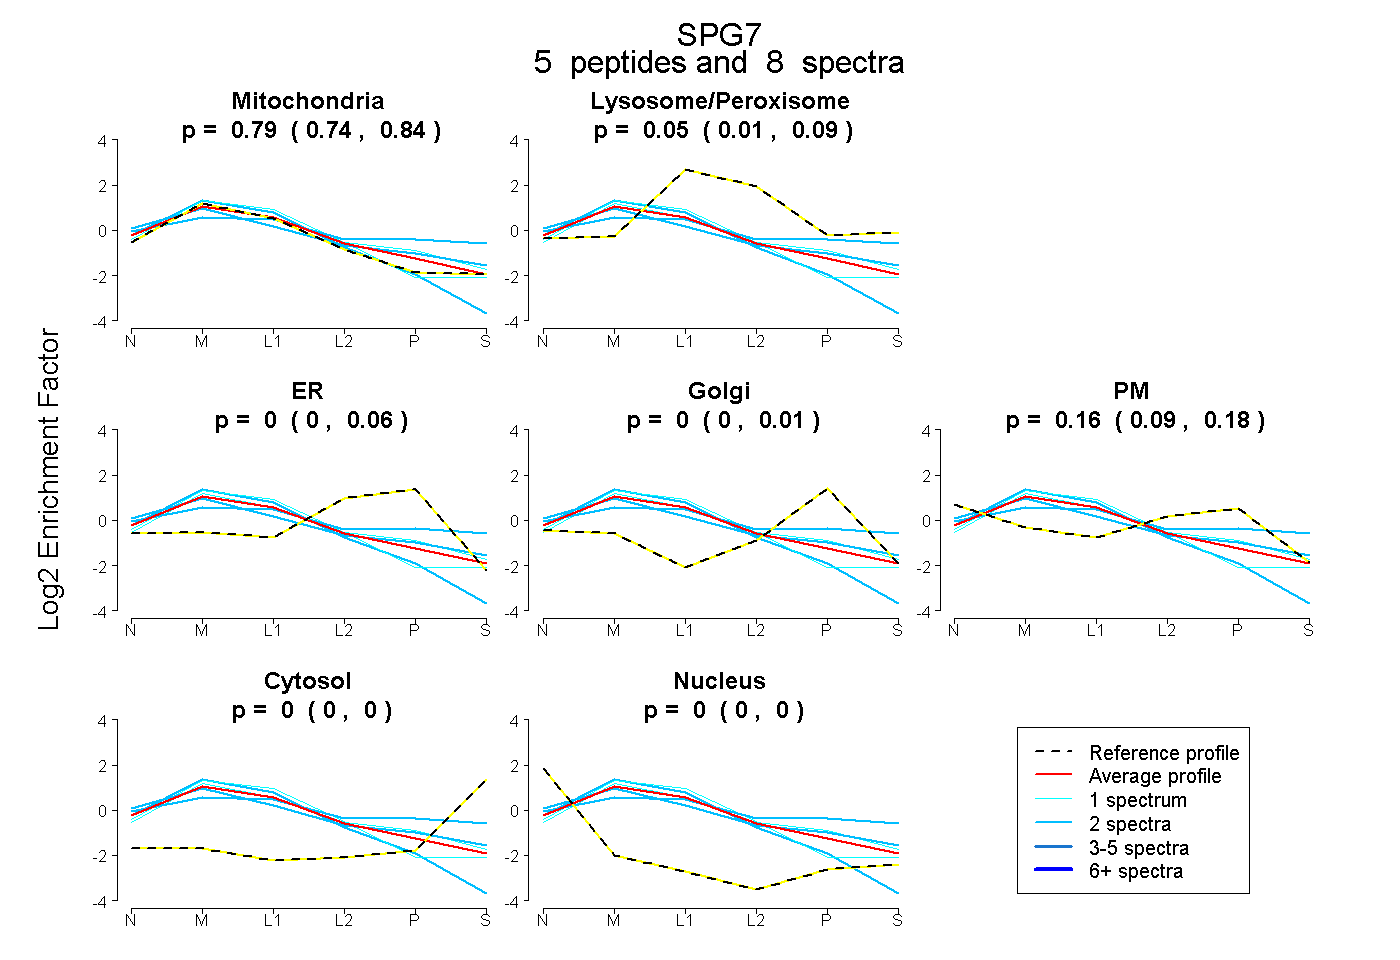 |
0.791 0.740 | 0.837 |
0.051 0.006 | 0.086 |
0.000 0.000 | 0.058 |
0.000 0.000 | 0.012 |
0.158 0.094 | 0.184 |
0.000 0.000 | 0.000 |
0.000 0.000 | 0.000 |
|||
| Plot | Lyso | Other | |||||||||||
| Expt C |
22 peptides |
81 spectra |
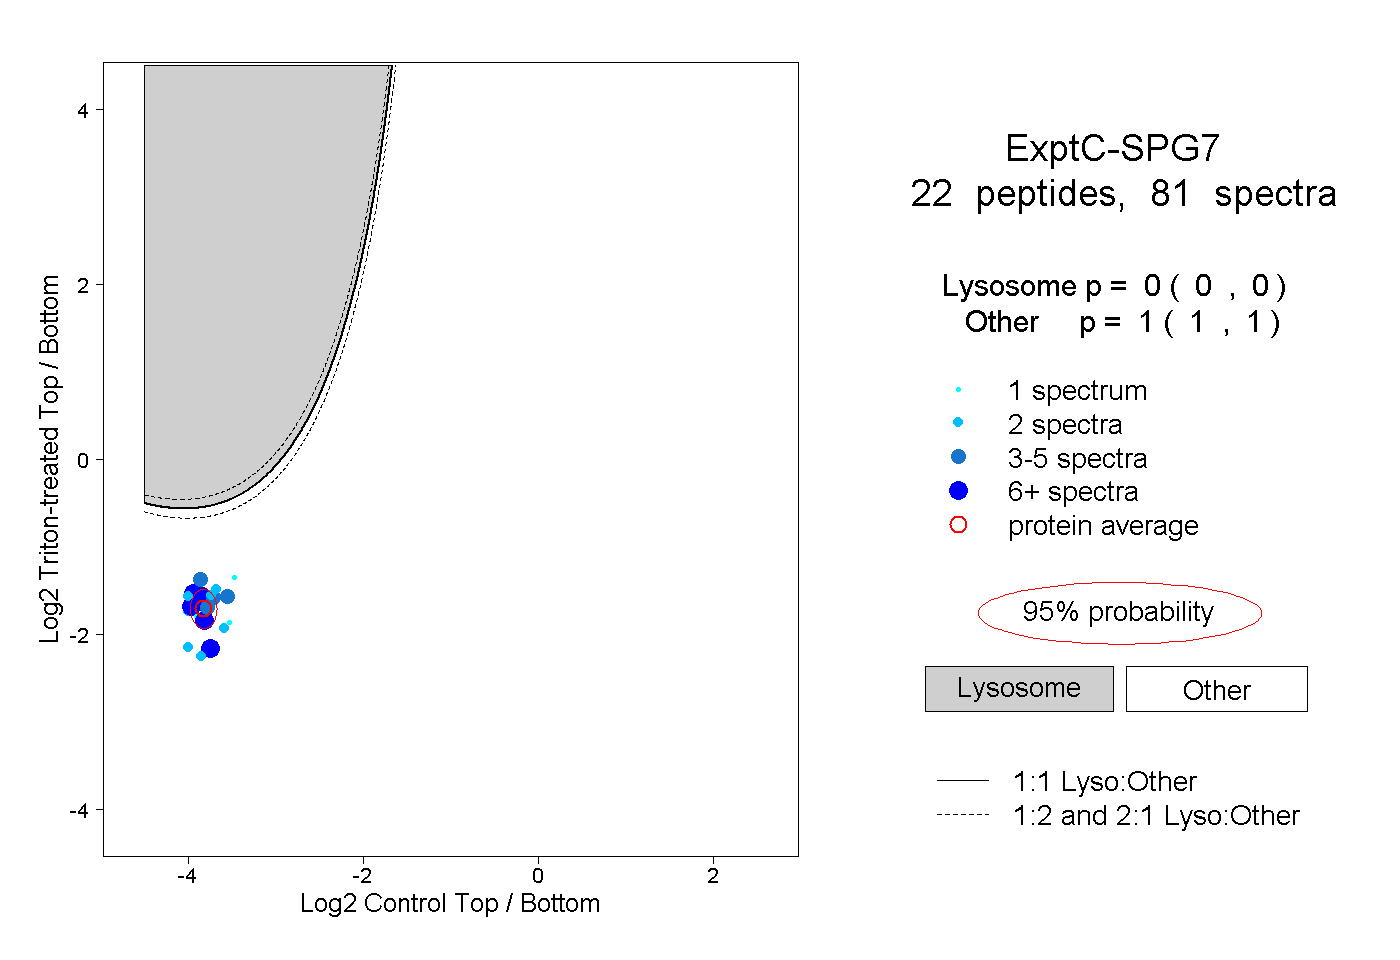 |
0.000 0.000 | 0.000 |
1.000 1.000 | 1.000 |
||||||||
| Plot | Lyso | Other | |||||||||||
| Expt D |
5 peptides |
13 spectra |
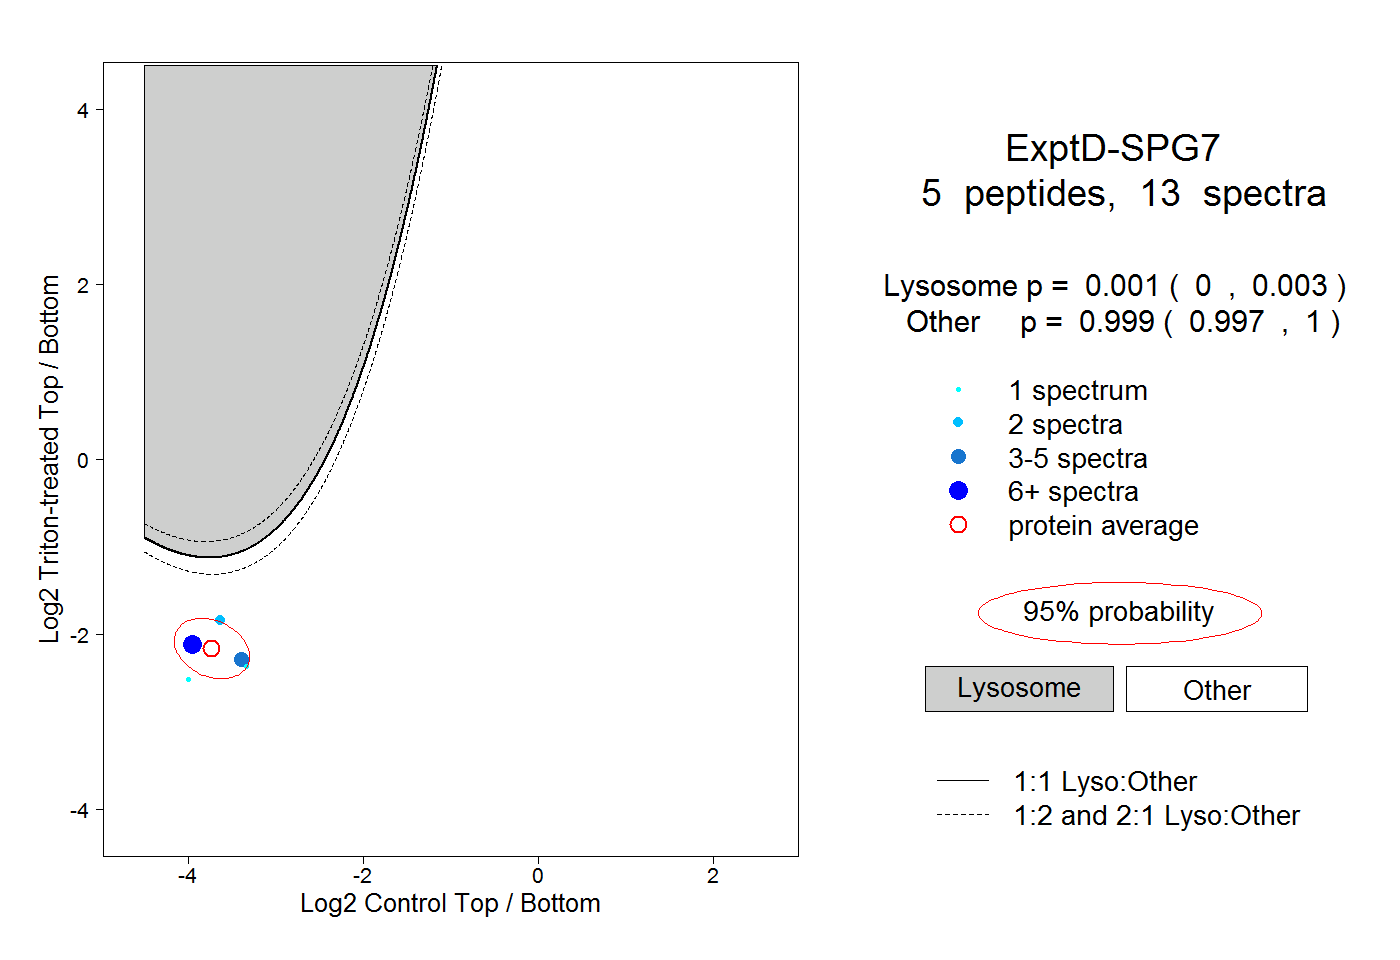 |
0.001 0.000 | 0.003 |
0.999 0.997 | 1.000 |