 8
8peptides
spectra
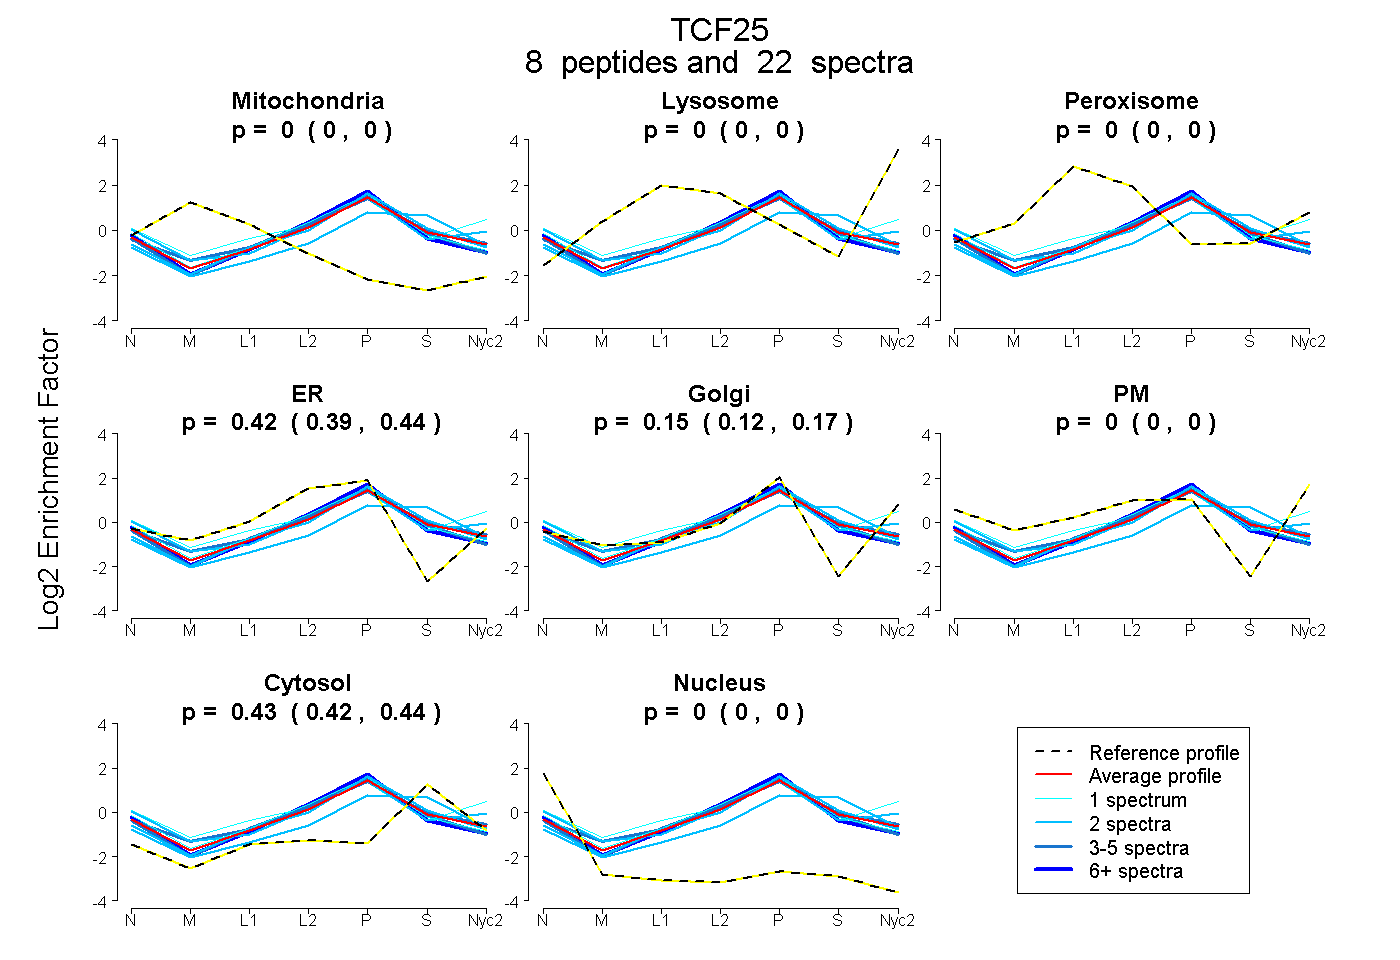
0.000 | 0.000
0.000 | 0.000
0.000 | 0.000
0.394 | 0.437
0.122 | 0.173
0.000 | 0.000
0.423 | 0.440
0.000 | 0.000
3peptides
spectra
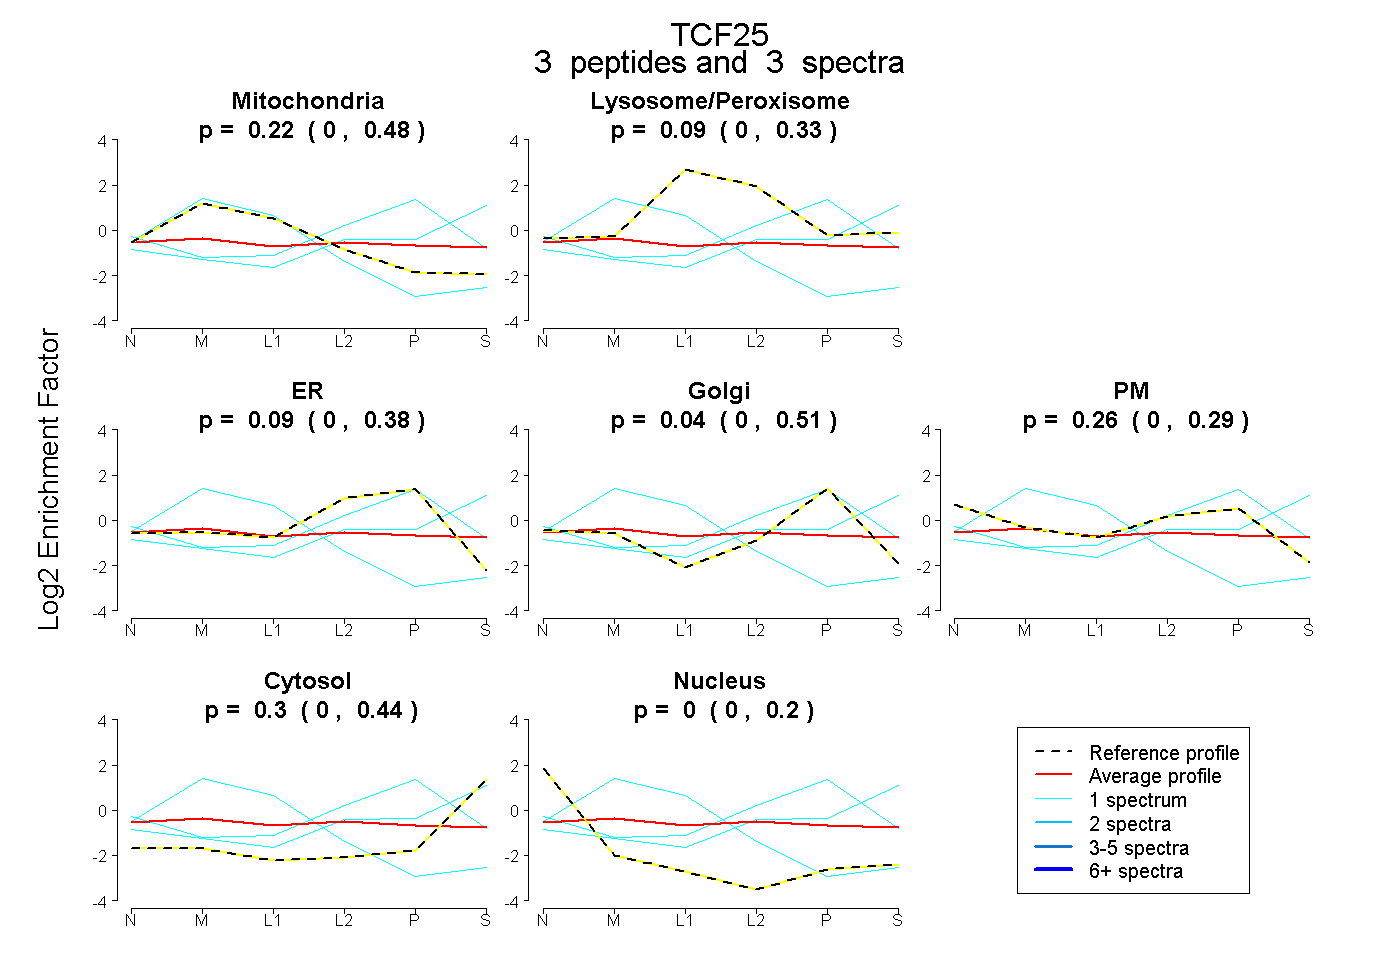
0.000 | 0.481
0.000 | 0.328
0.000 | 0.376
0.000 | 0.514
0.000 | 0.293
0.000 | 0.439
0.000 | 0.202
8peptides
spectra
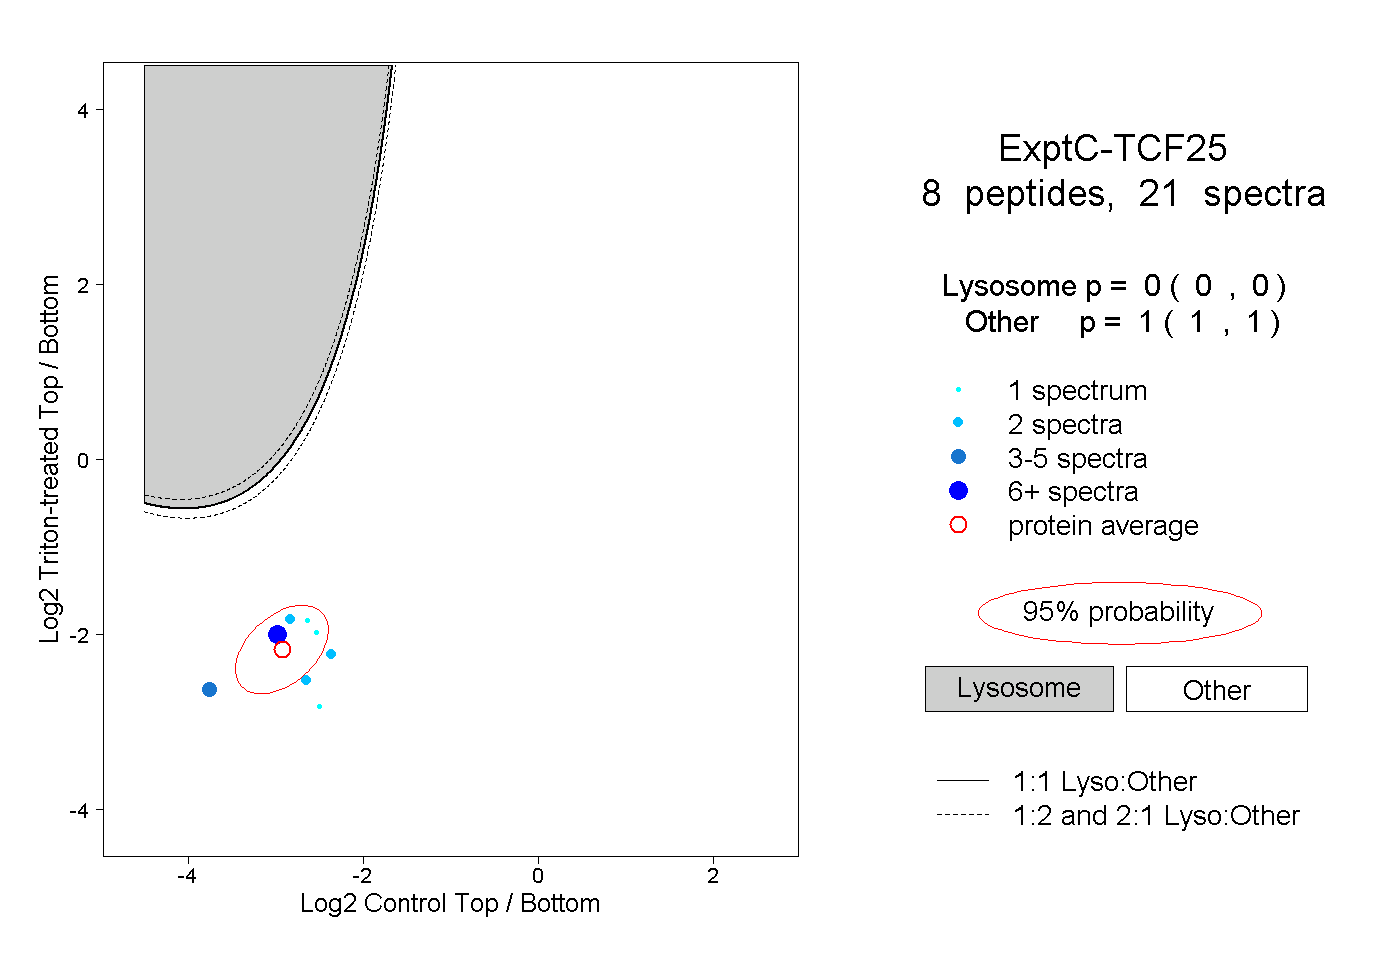
0.000 | 0.000
1.000 | 1.000