 8
8peptides
spectra
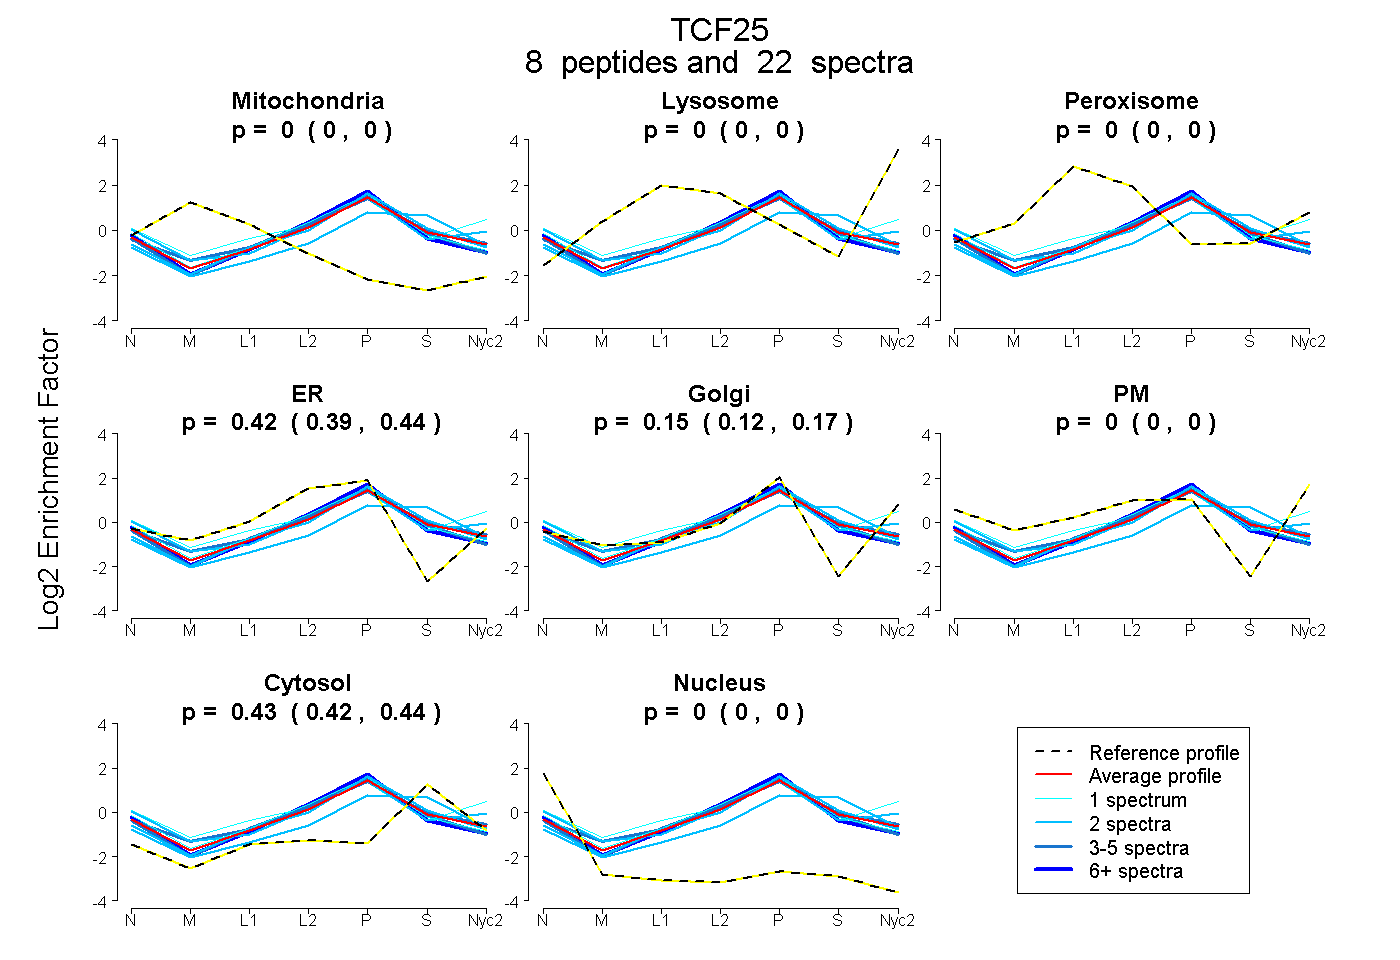
0.000 | 0.000
0.000 | 0.000
0.000 | 0.000
0.394 | 0.437
0.122 | 0.173
0.000 | 0.000
0.423 | 0.440
0.000 | 0.000
| Plot | Mito | Lyso | Perox | ER | Golgi | PM | Cytosol | Nucleus | |||||
| Expt A |
8 peptides |
22 spectra |
|
0.000 0.000 | 0.000 |
0.000 0.000 | 0.000 |
0.000 0.000 | 0.000 |
0.417 0.394 | 0.437 |
0.150 0.122 | 0.173 |
0.000 0.000 | 0.000 |
0.432 0.423 | 0.440 |
0.000 0.000 | 0.000 |
| 5 spectra, FQEDQEMAR | 0.000 | 0.000 | 0.000 | 0.578 | 0.000 | 0.000 | 0.422 | 0.000 | ||
| 2 spectra, LFQEWEAHR | 0.000 | 0.000 | 0.000 | 0.094 | 0.270 | 0.000 | 0.636 | 0.000 | ||
| 1 spectrum, HVILSEIK | 0.000 | 0.000 | 0.111 | 0.038 | 0.399 | 0.183 | 0.268 | 0.000 | ||
| 3 spectra, IMLAVR | 0.000 | 0.000 | 0.000 | 0.454 | 0.100 | 0.000 | 0.446 | 0.000 | ||
| 6 spectra, AVLGEQRPR | 0.000 | 0.000 | 0.000 | 0.545 | 0.054 | 0.000 | 0.400 | 0.000 | ||
| 2 spectra, NYEYLIR | 0.000 | 0.000 | 0.000 | 0.247 | 0.367 | 0.047 | 0.339 | 0.000 | ||
| 2 spectra, SLLPNYTTEGER | 0.000 | 0.000 | 0.000 | 0.388 | 0.147 | 0.000 | 0.465 | 0.000 | ||
| 1 spectrum, SHFLWK | 0.000 | 0.000 | 0.000 | 0.571 | 0.026 | 0.000 | 0.404 | 0.000 |
| Plot | Mito | Lyso or Perox | ER | Golgi | PM | Cytosol | Nucleus | ||||||
| Expt B |
3 peptides |
3 spectra |
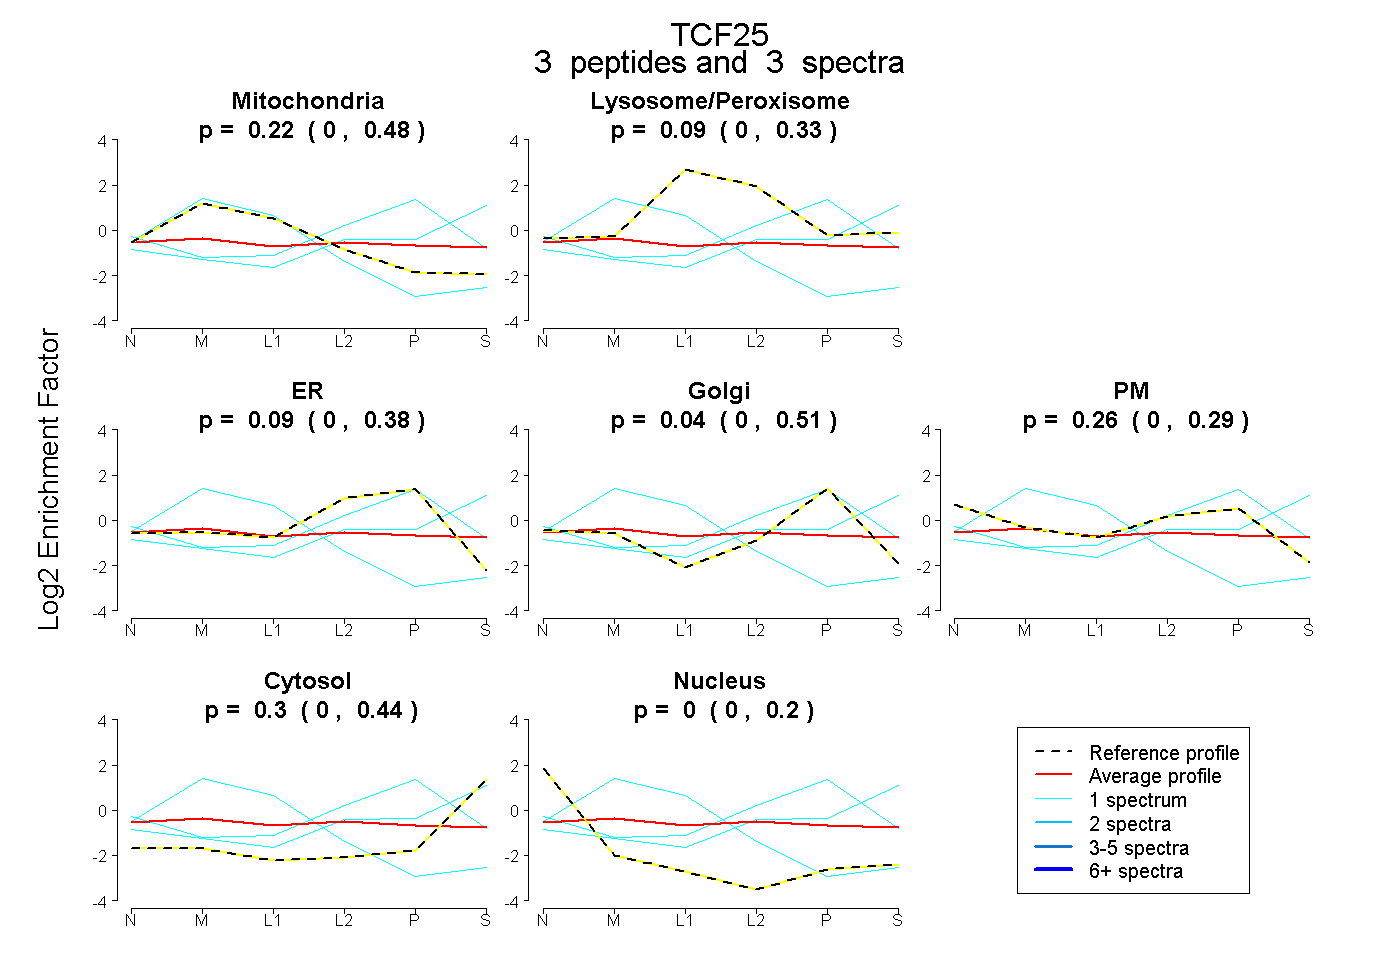 |
0.224 0.000 | 0.481 |
0.088 0.000 | 0.328 |
0.089 0.000 | 0.376 |
0.036 0.000 | 0.514 |
0.262 0.000 | 0.293 |
0.302 0.000 | 0.439 |
0.000 0.000 | 0.202 |
|||
| Plot | Lyso | Other | |||||||||||
| Expt C |
8 peptides |
21 spectra |
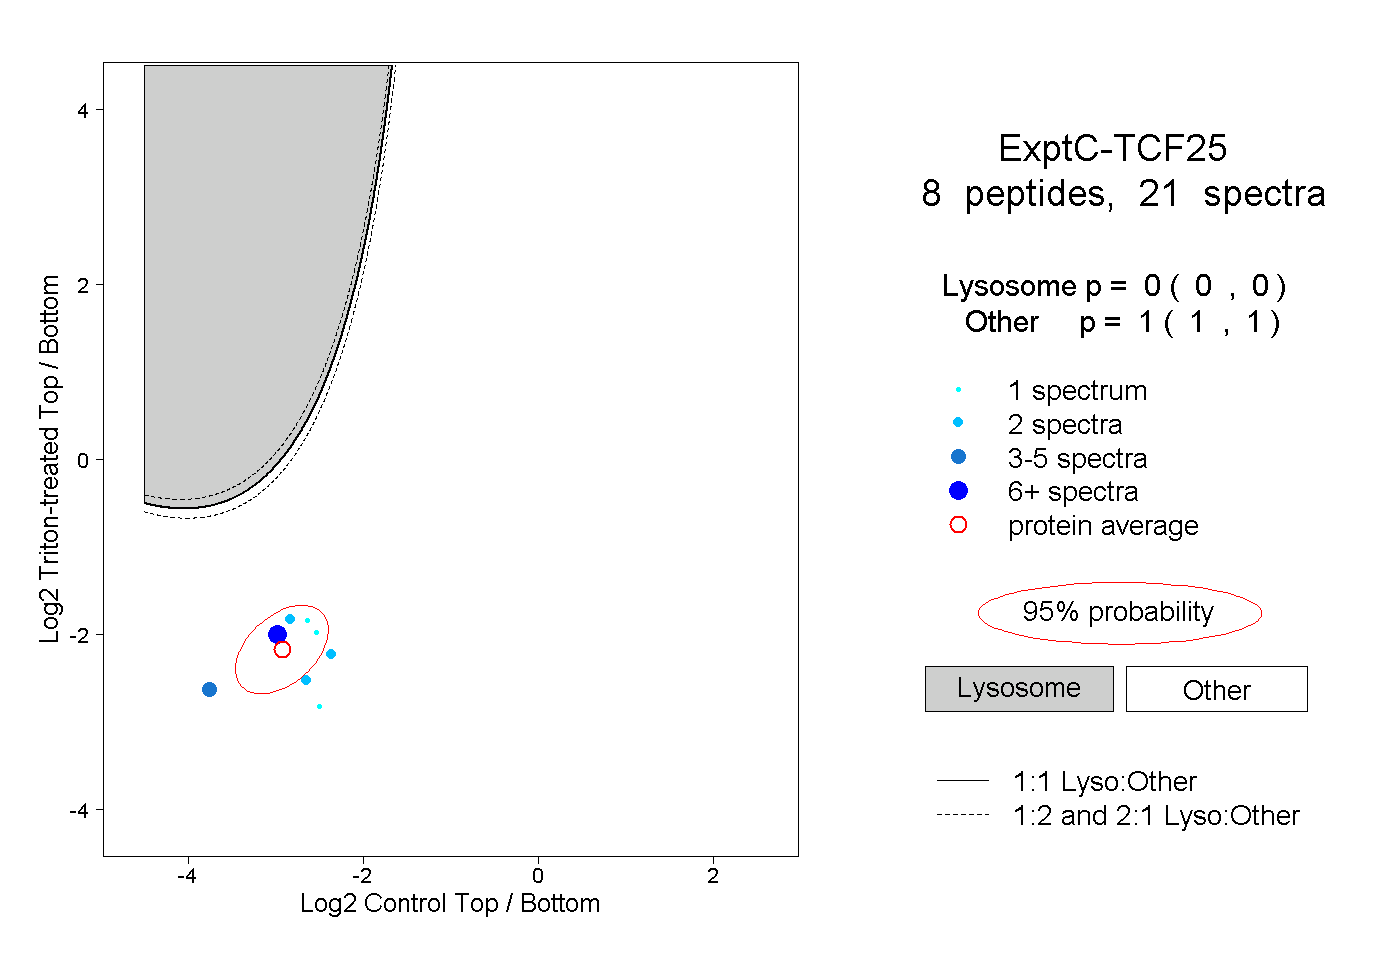 |
0.000 0.000 | 0.000 |
1.000 1.000 | 1.000 |