 12
12peptides
spectra
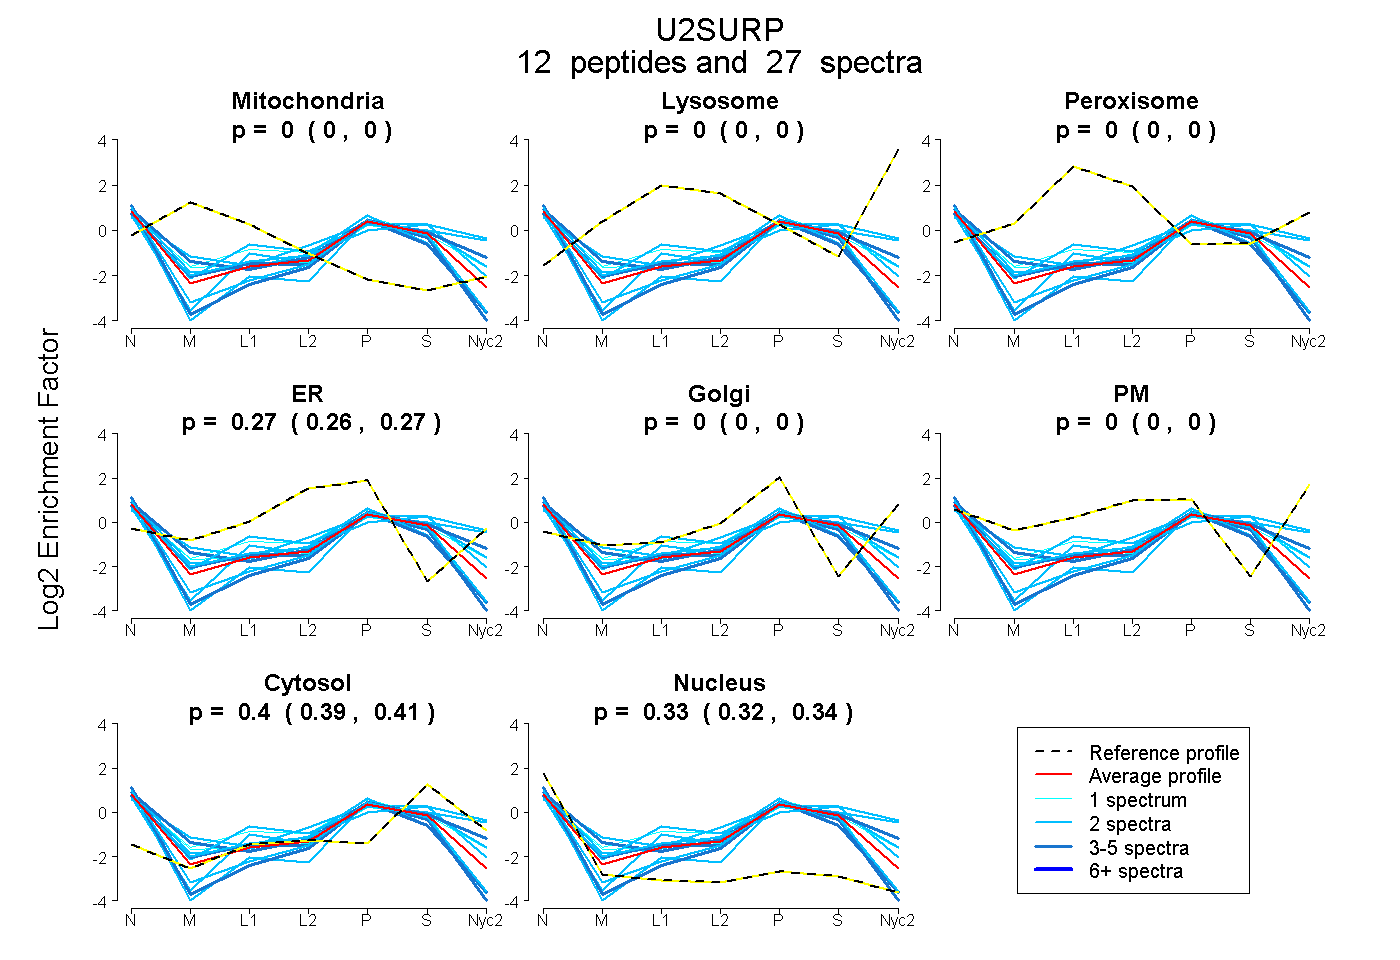
0.000 | 0.000
0.000 | 0.000
0.000 | 0.000
0.258 | 0.273
0.000 | 0.000
0.000 | 0.000
0.394 | 0.412
0.318 | 0.340
2peptides
spectra
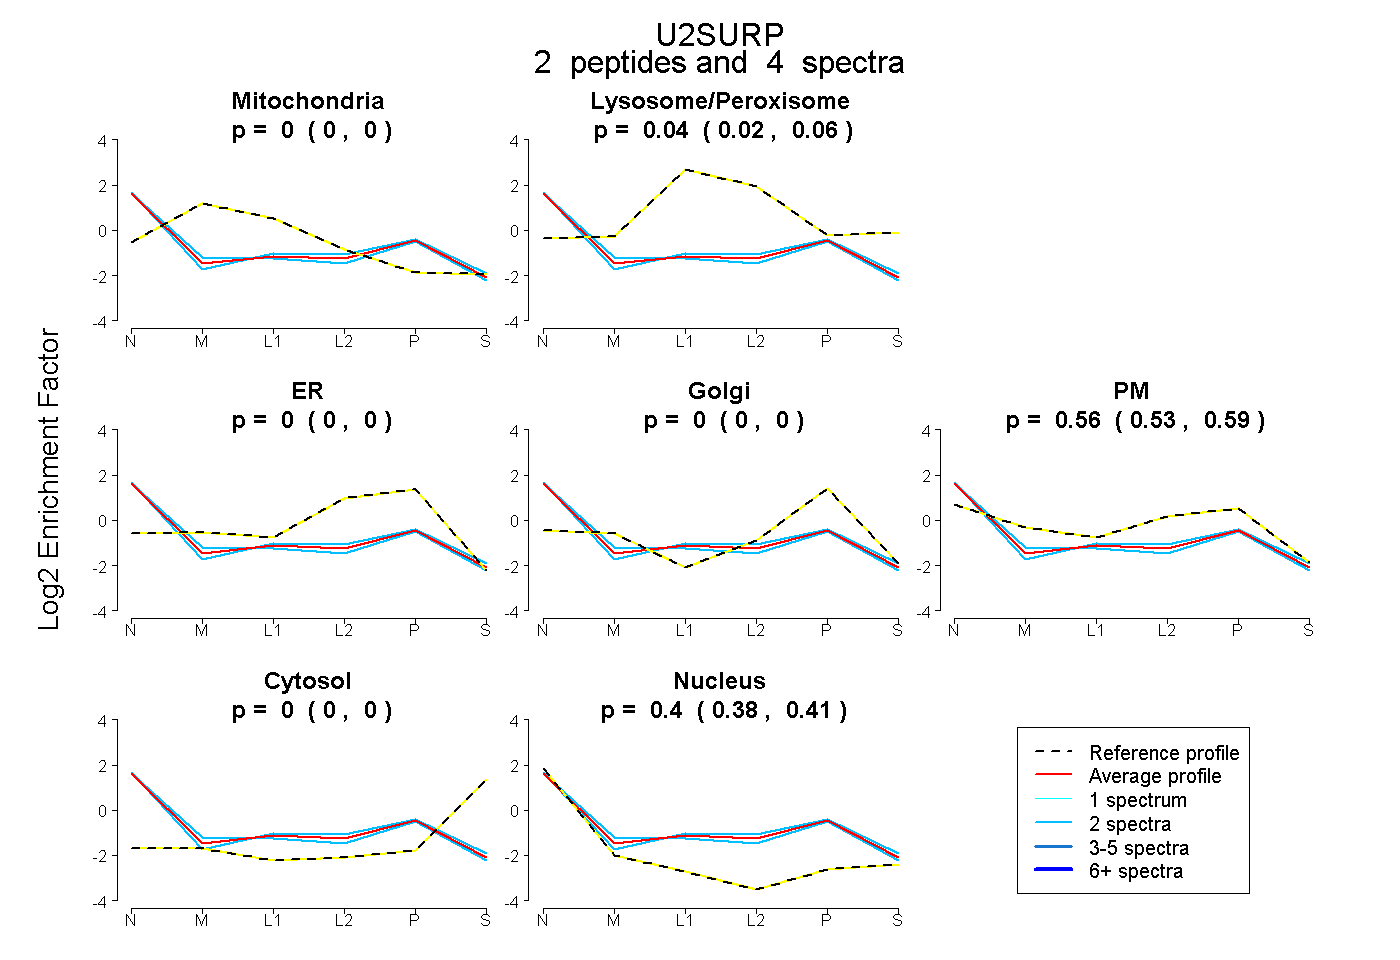
0.000 | 0.000
0.018 | 0.056
0.000 | 0.000
0.000 | 0.000
0.528 | 0.590
0.000 | 0.000
0.378 | 0.414
3peptides
spectra
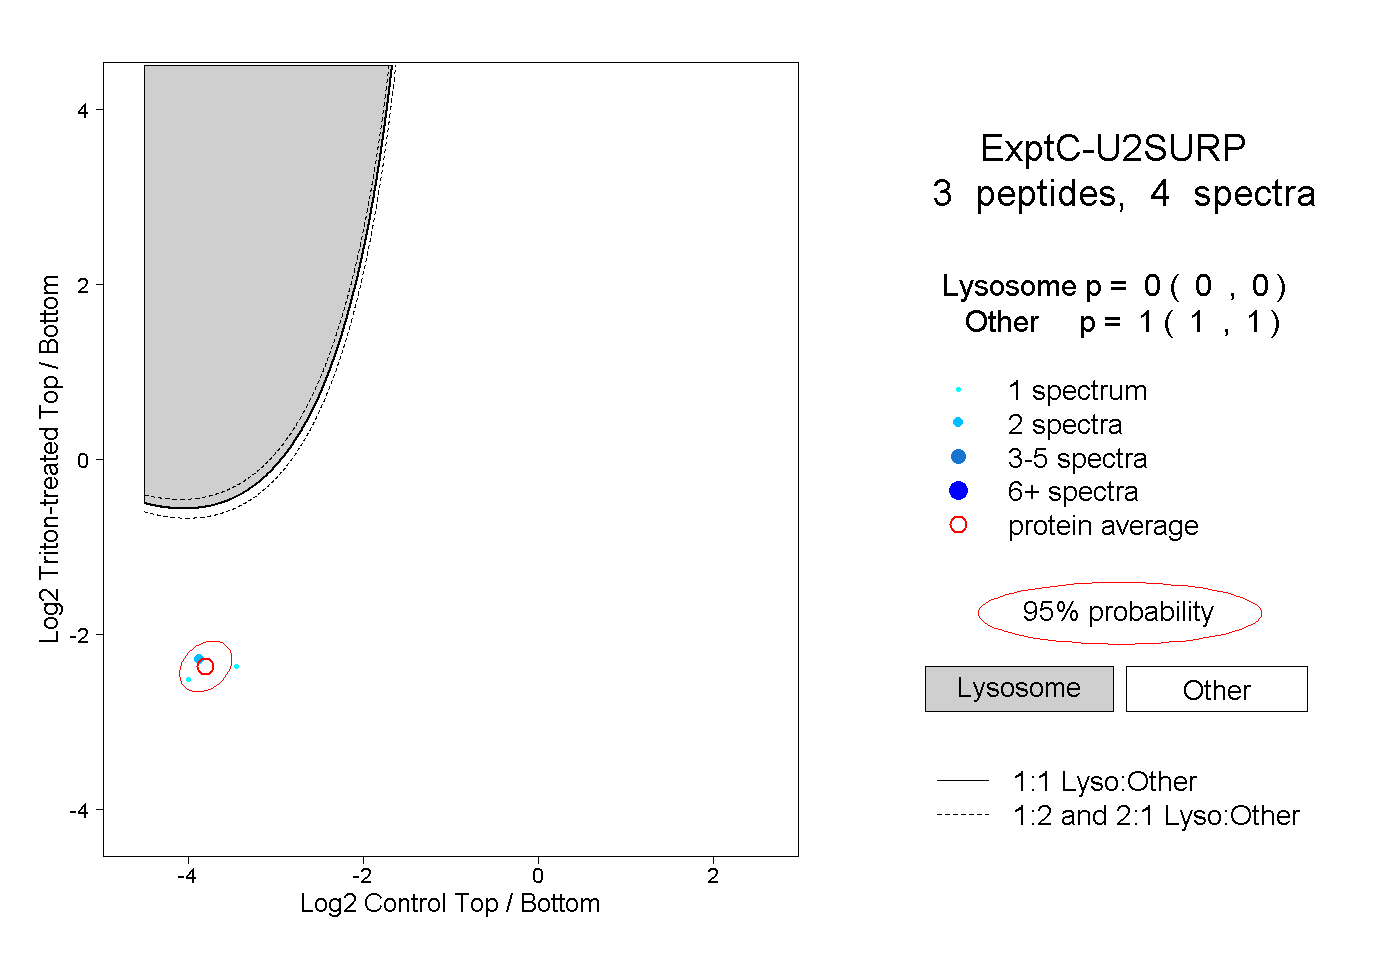
0.000 | 0.000
1.000 | 1.000