 10
10peptides
spectra
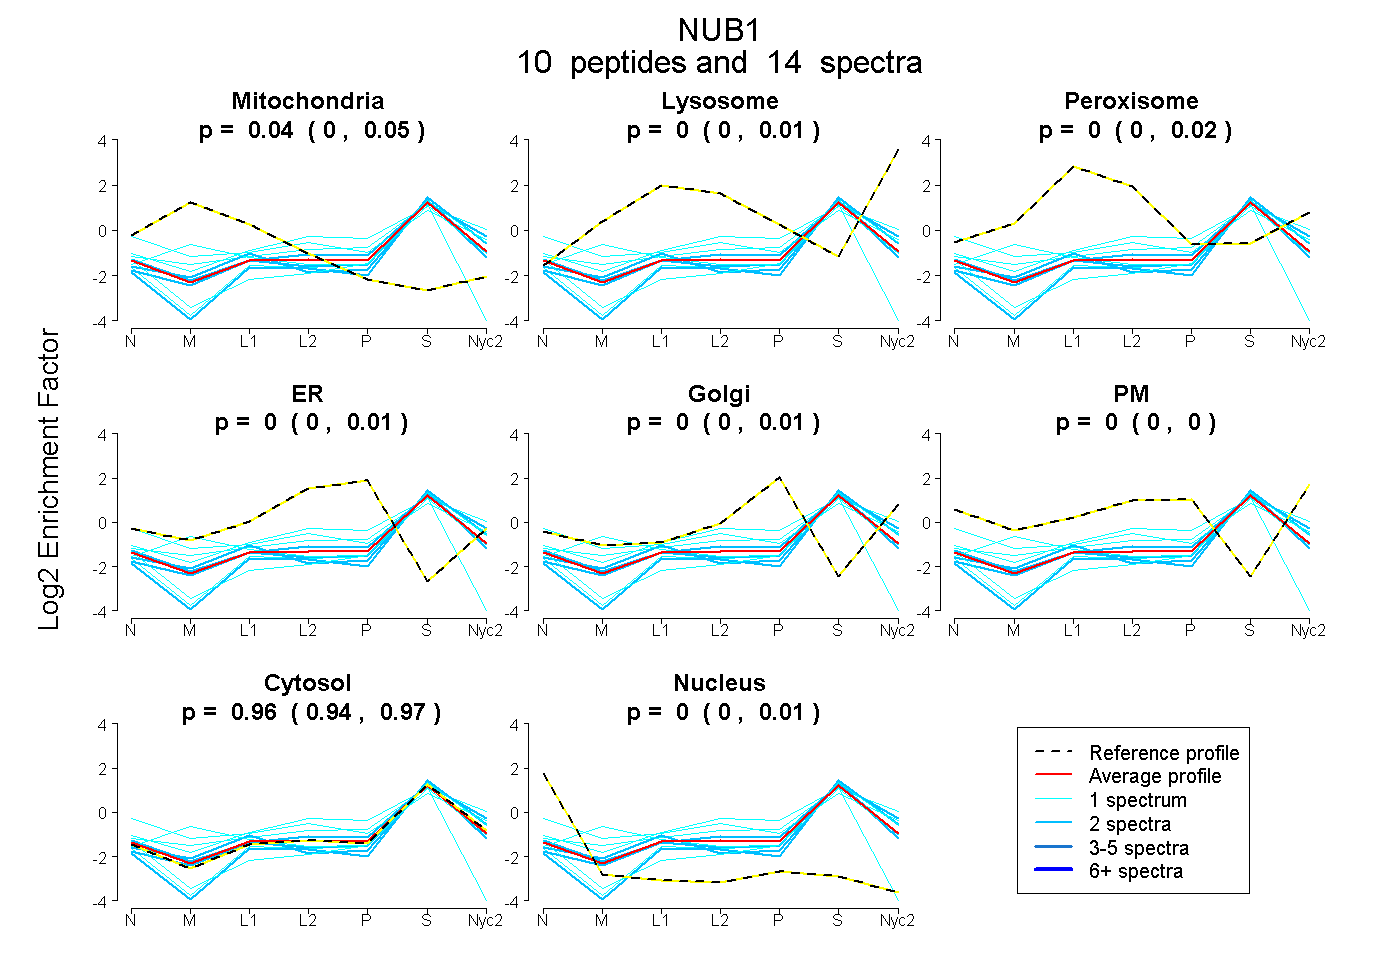
0.000 | 0.054
0.000 | 0.009
0.000 | 0.018
0.000 | 0.009
0.000 | 0.009
0.000 | 0.000
0.937 | 0.973
0.000 | 0.009
2peptides
spectra
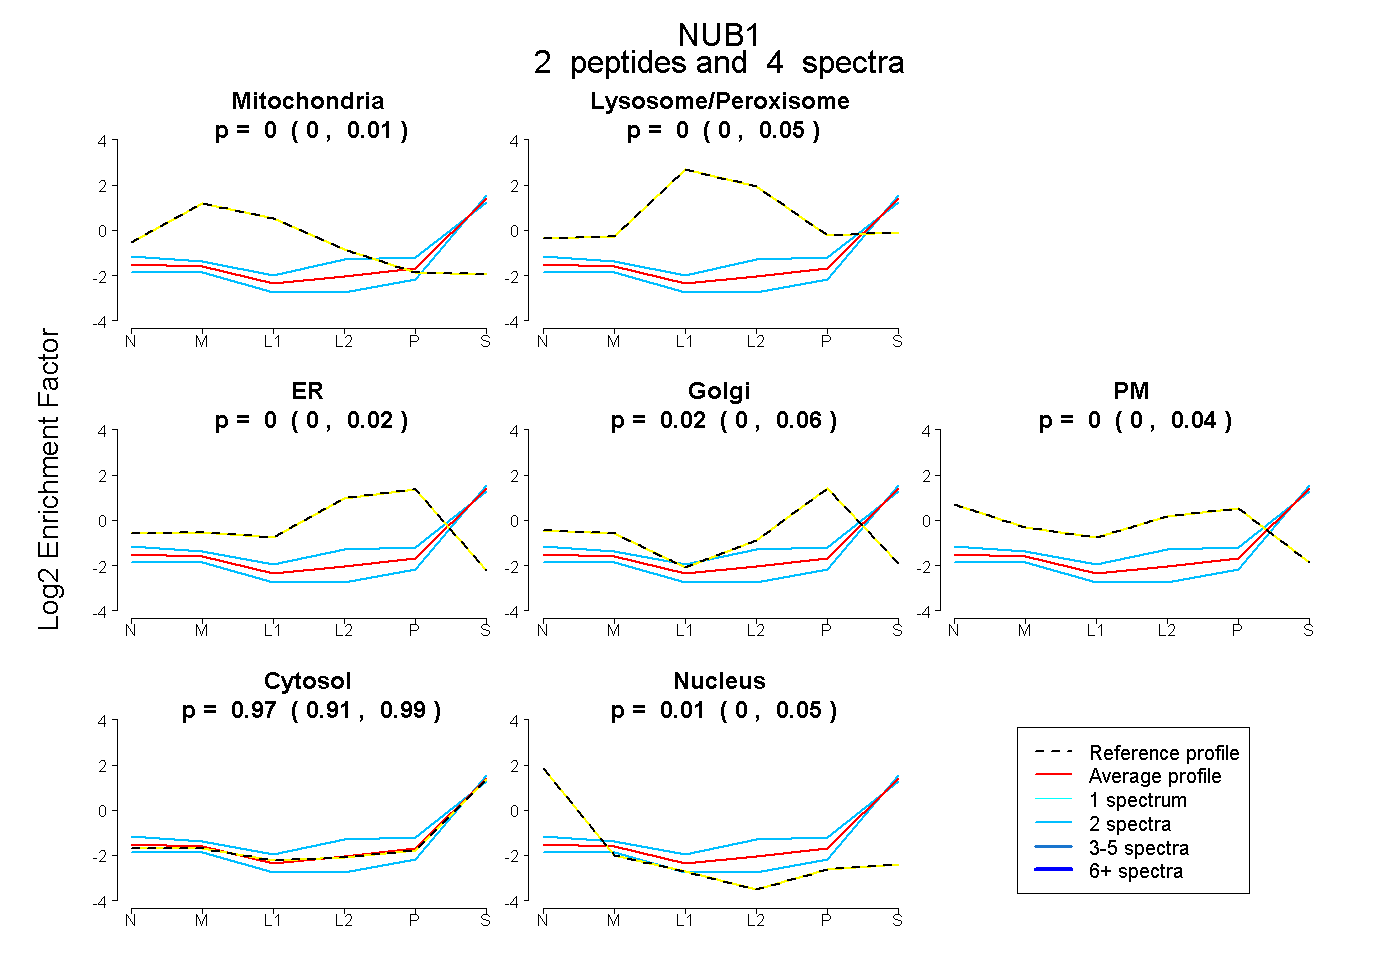
0.000 | 0.011
0.000 | 0.046
0.000 | 0.019
0.000 | 0.055
0.000 | 0.037
0.911 | 0.991
0.000 | 0.050
9peptides
spectra
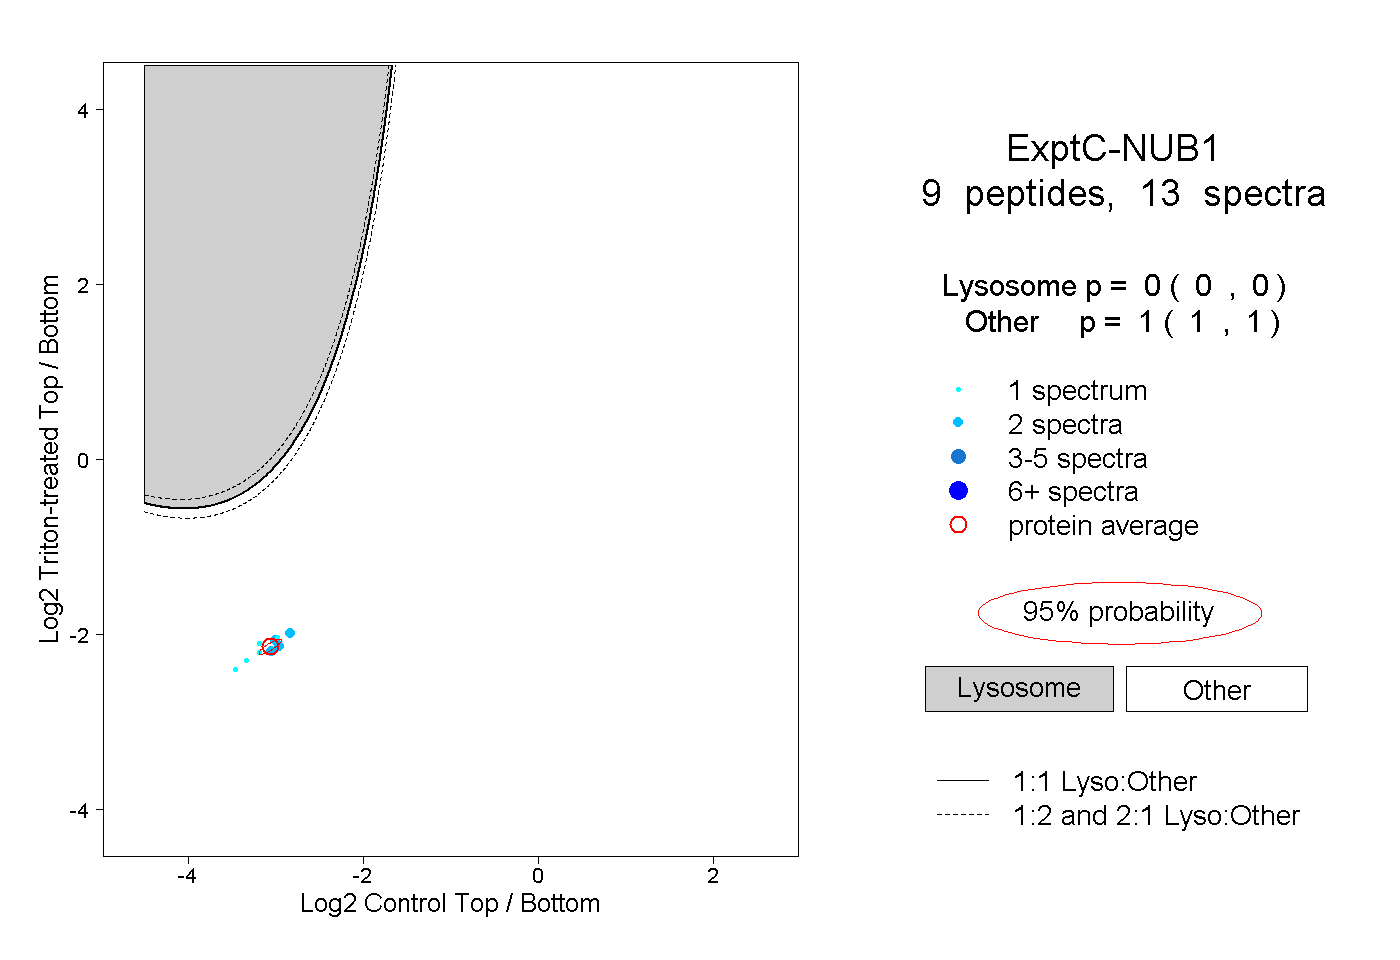
0.000 | 0.000
1.000 | 1.000