NUB1
[ENSRNOP00000048314]
Main page
| | | Plot |
Mito |
Lyso |
|
Perox |
ER |
Golgi |
PM |
Cytosol |
Nucleus |
|
| Expt A |
 10
10
peptides |
14
spectra |
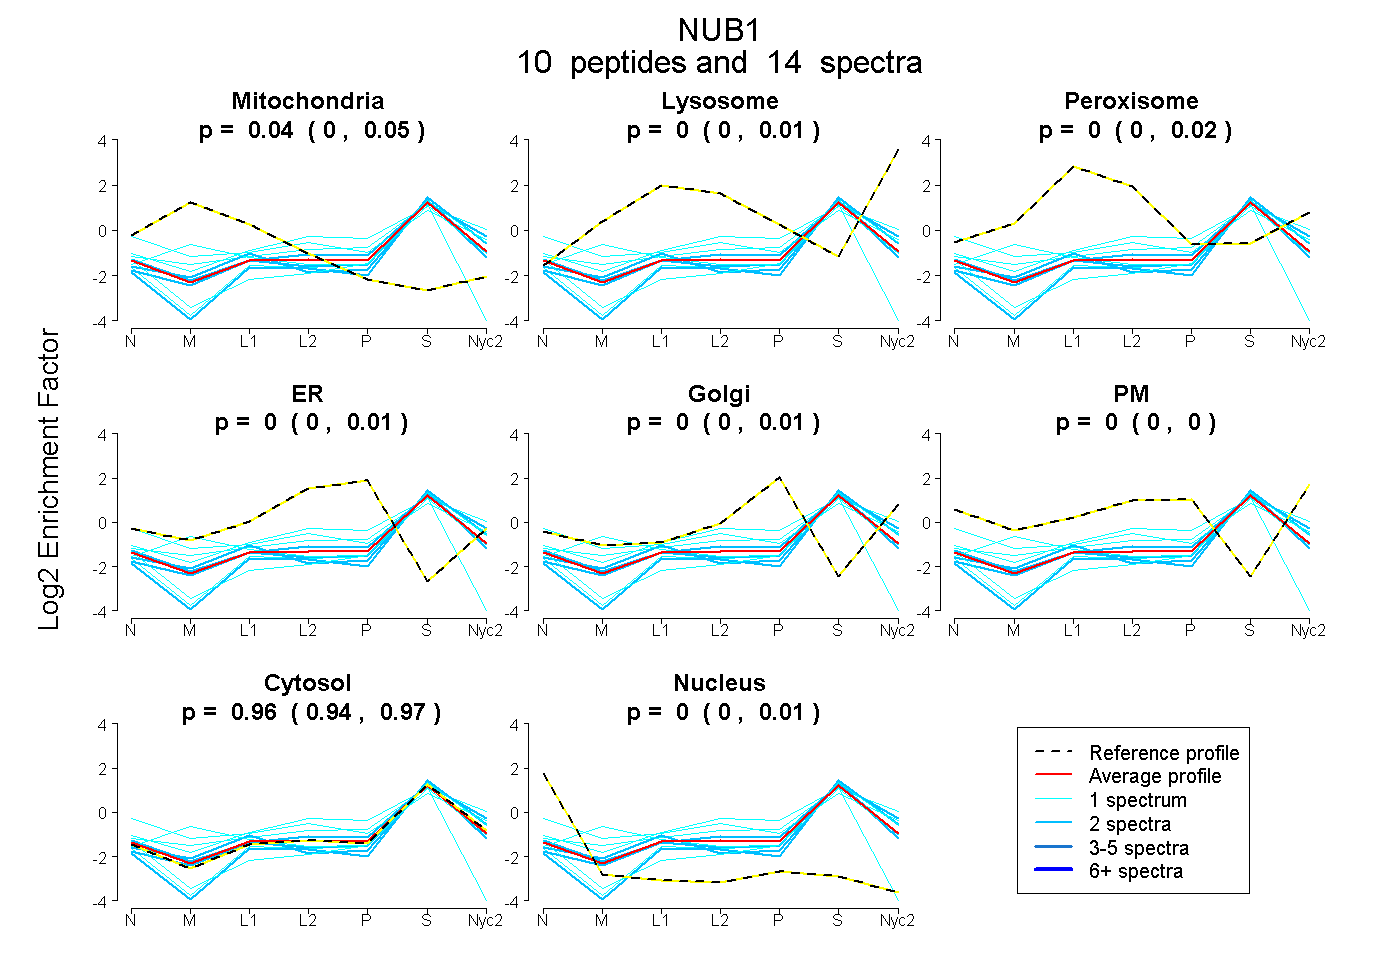 |
0.035
0.000 | 0.054 |
0.000
0.000 | 0.009 |
|
0.005
0.000 | 0.018 |
0.000
0.000 | 0.009 |
0.000
0.000 | 0.009 |
0.000
0.000 | 0.000 |
0.960
0.937 | 0.973 |
0.000
0.000 | 0.009 |
|
| | | Plot |
Mito |
|
Lyso or Perox |
|
ER |
Golgi |
PM |
Cytosol |
Nucleus |
|
| Expt B |
2
peptides |
4
spectra |
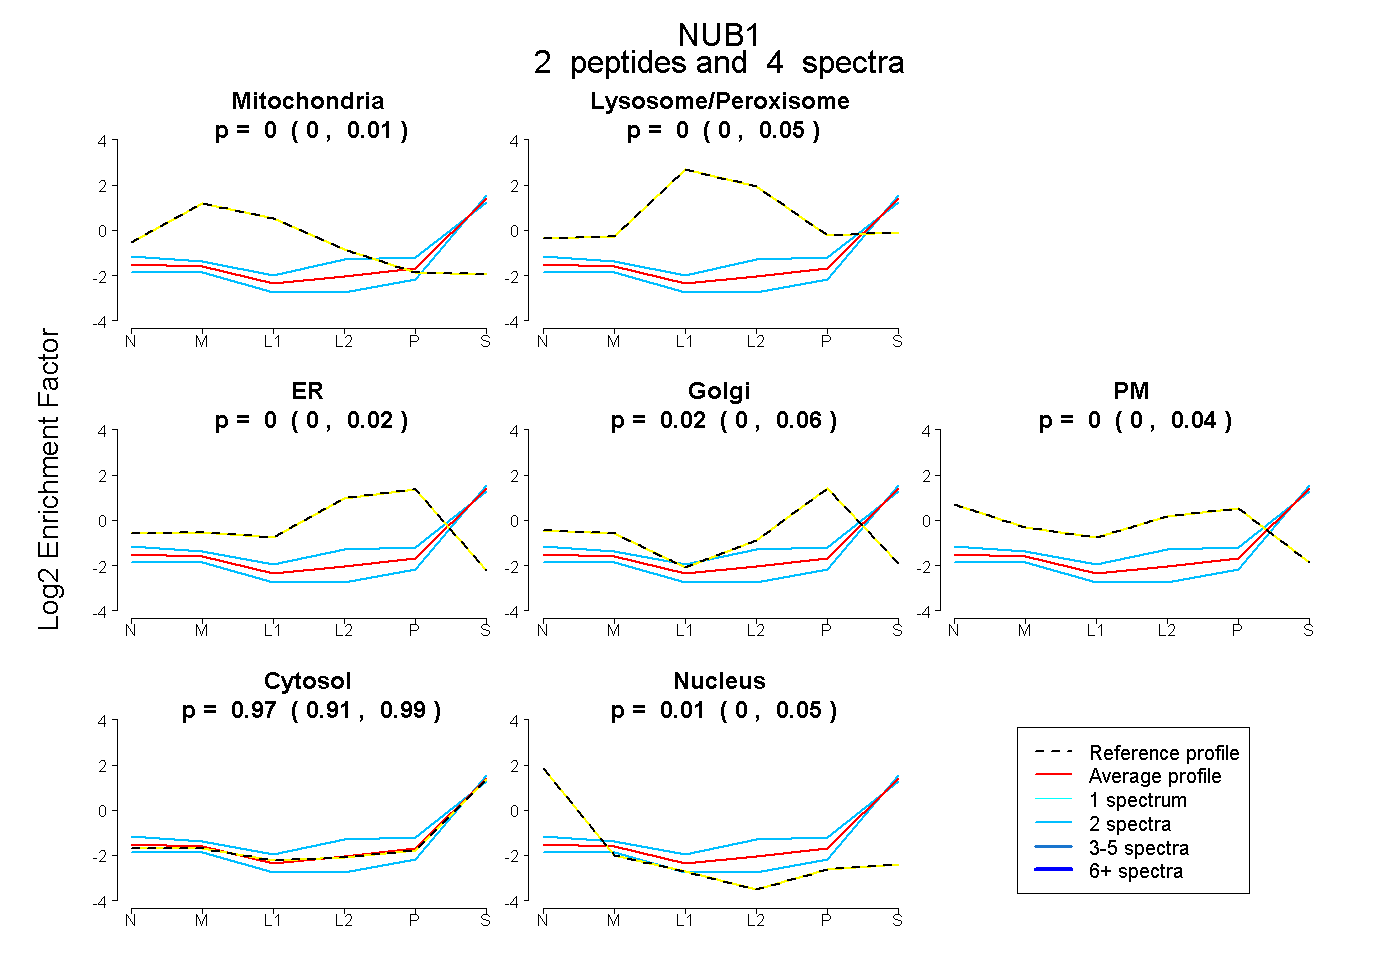 |
0.000
0.000 | 0.011 |
|
0.000
0.000 | 0.046 |
|
0.000
0.000 | 0.019 |
0.016
0.000 | 0.055 |
0.003
0.000 | 0.037 |
0.971
0.911 | 0.991 |
0.010
0.000 | 0.050 |
|
| | | Plot |
|
Lyso |
|
|
|
|
|
|
|
Other |
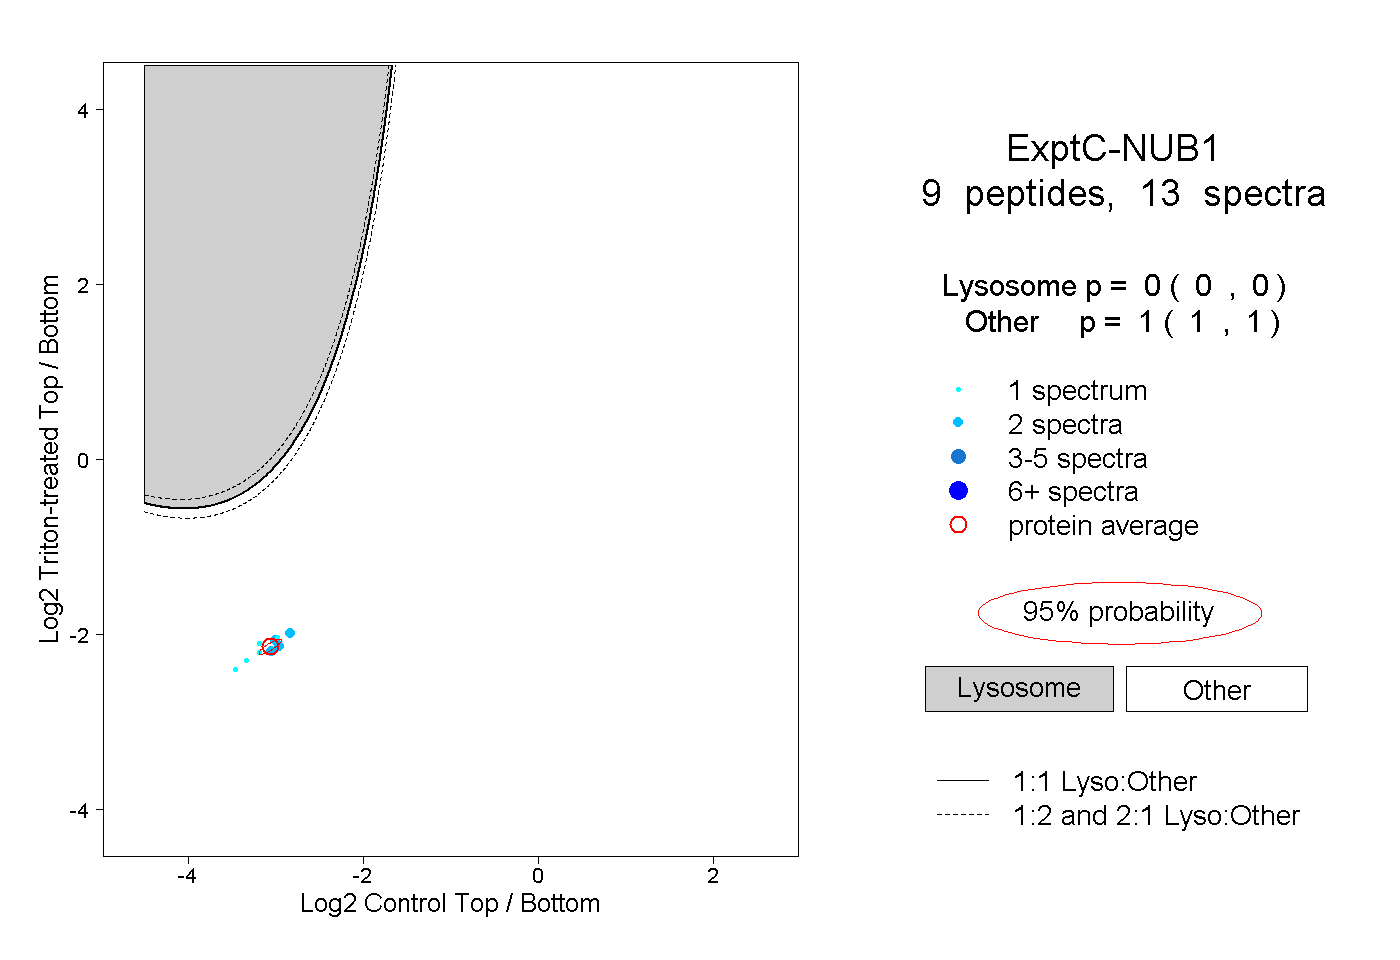
| Expt C |
9
peptides |
13
spectra |
 |
|
0.000
0.000 | 0.000 |
|
|
|
|
|
|
|
1.000
1.000 | 1.000 |
| 1 spectrum, SLEEQGVTHNVK |
|
0.000 |
|
|
|
|
|
|
|
1.000 |
| 2 spectra, GNLDDALK |
|
0.000 |
|
|
|
|
|
|
|
1.000 |
| 1 spectrum, GMGYSTQAAK |
|
0.000 |
|
|
|
|
|
|
|
1.000 |
| 1 spectrum, EELAQIR |
|
0.000 |
|
|
|
|
|
|
|
1.000 |
| 2 spectra, GTGNEHYR |
|
0.000 |
|
|
|
|
|
|
|
1.000 |
| 1 spectrum, ELYIDPSK |
|
0.000 |
|
|
|
|
|
|
|
1.000 |
| 2 spectra, GLEILAER |
|
0.000 |
|
|
|
|
|
|
|
1.000 |
| 2 spectra, LTQFLR |
|
0.000 |
|
|
|
|
|
|
|
1.000 |
| 1 spectrum, LYLLQGIR |
|
0.000 |
|
|
|
|
|
|
|
1.000 |